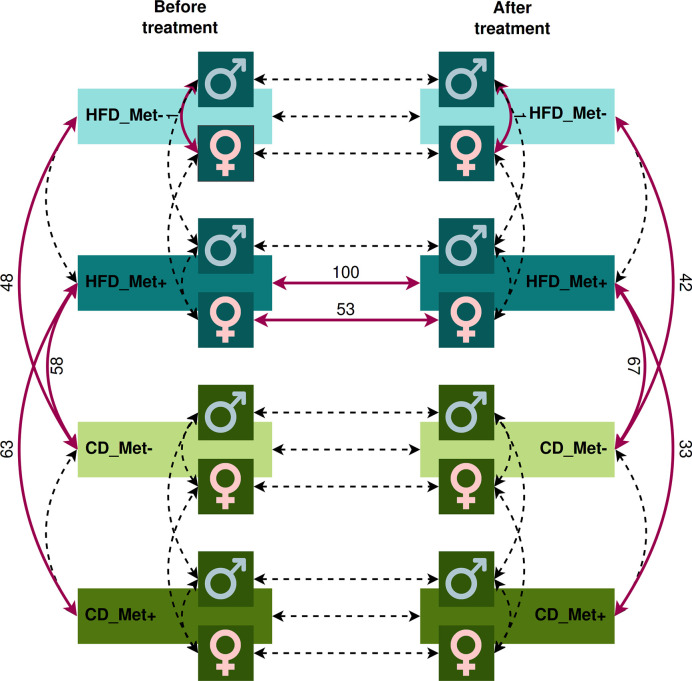
Figure 3.
Contrasts in which microbiome compositions were compared. Dashed lines indicate the contrasts between which a comparison was performed. Red bold lines indicate the contrasts between which statistically significant differences in taxa relative abundance at species level were discovered with the numbers of the different species.

