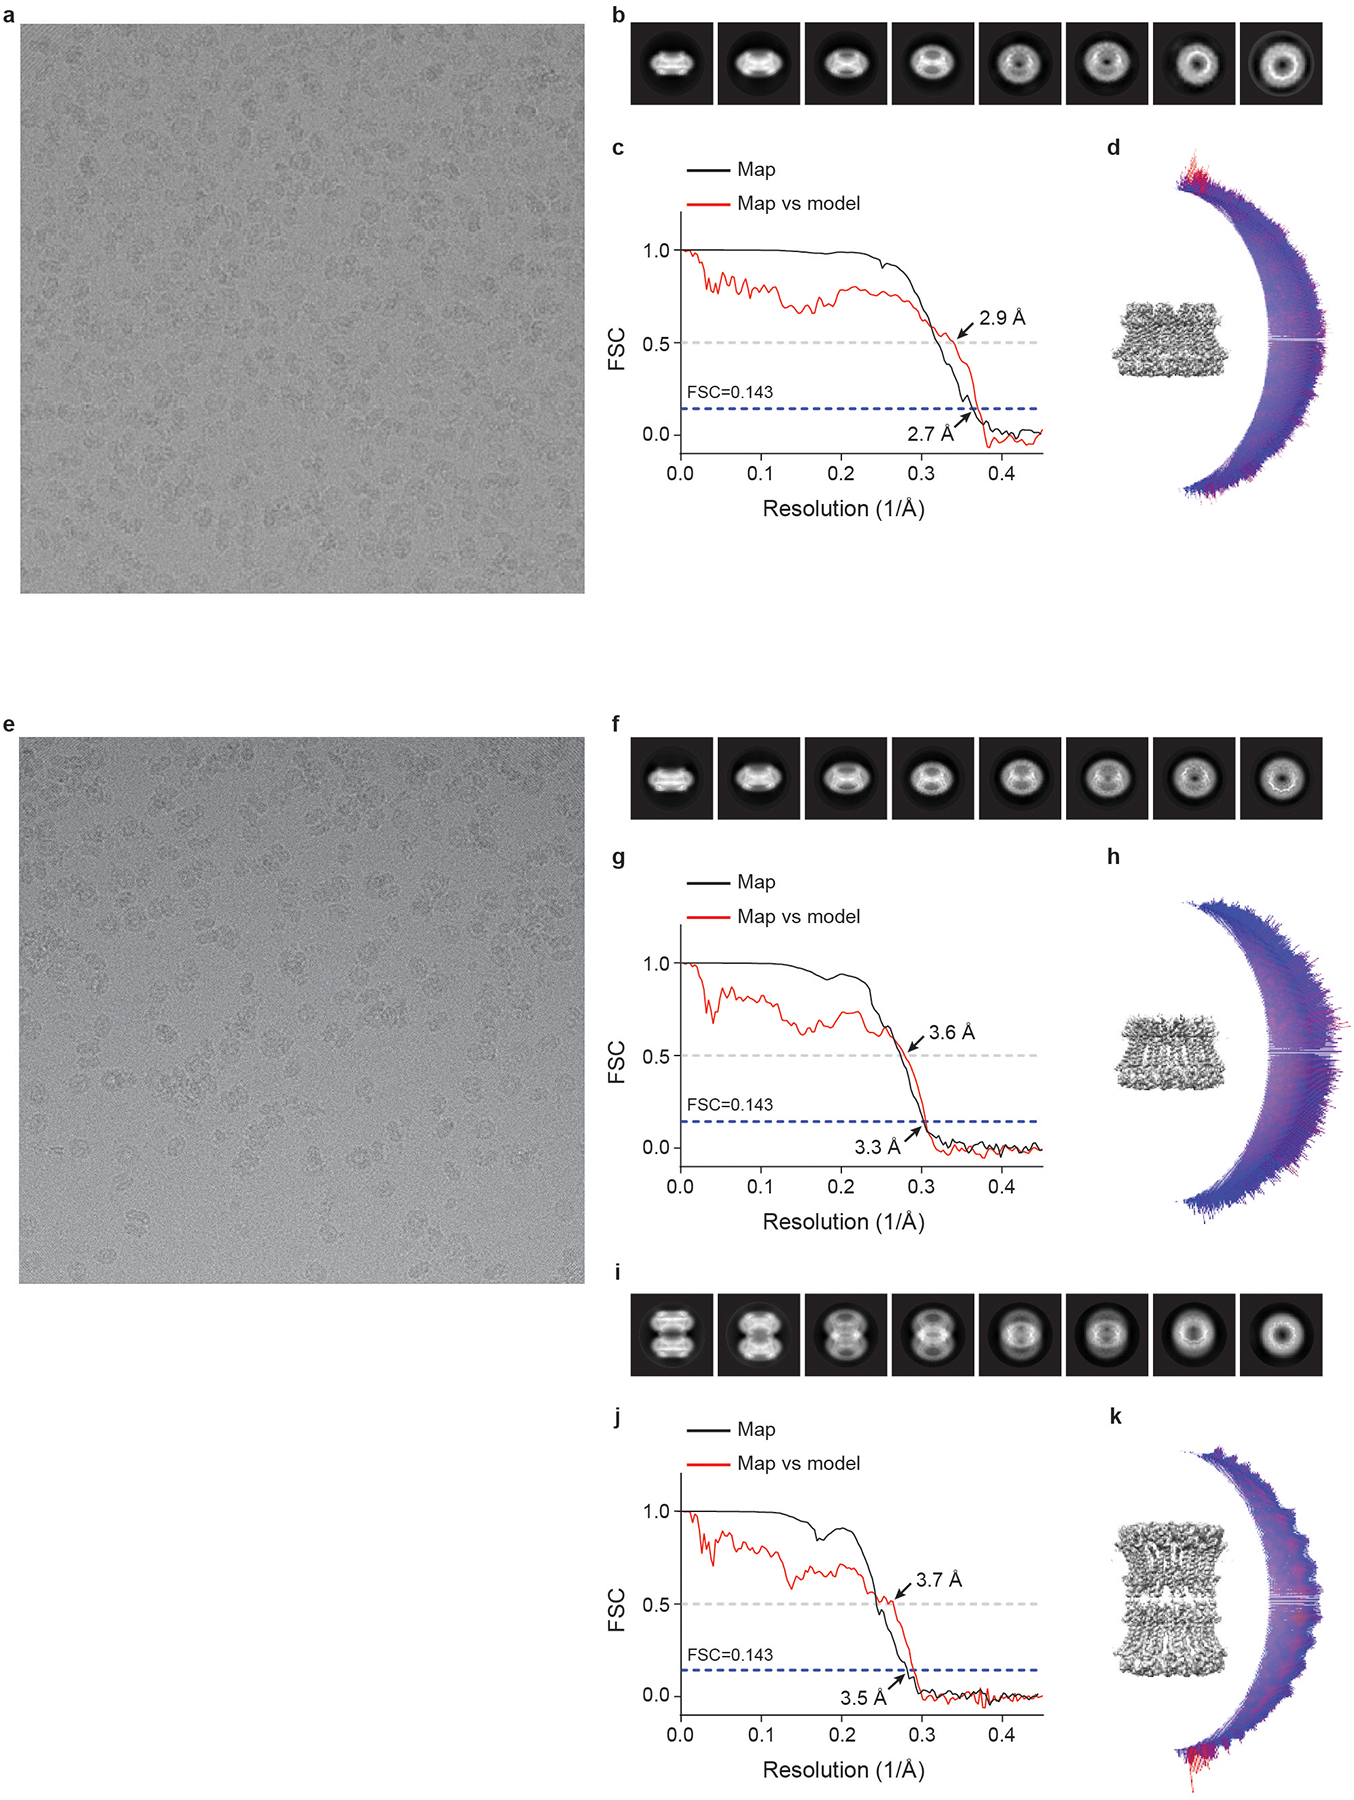
Extended Data Fig. 5 |. Cryo-EM analysis of human CALHM2.

a, e, Representative electron micrograph of RUR–CALHM2 (a, out of 5,025 micrographs) and EDTA–CALHM2 (e, out of 4,809 micrographs). b, f, i, Selected 2D class averages of the electron micrographs of RUR–CALHM2 (b), EDTA–CALHM2hemi (f) and EDTA–CALHM2gap (i). c, g, j, The gold-standard Fourier shell correlation curves for the electron microscopy maps of RUR–CALHM2 (c), EDTA–CALHM2hemi (g) and EDTA–CALHM2gap (j) are shown in black, and the Fourier shell correlation curves between the atomic model and the final electron microscopy map are shown in red. d, h, k, The angular distribution of particles used for the refinement of RUR–CALHM2 (d), EDTA–CALHM2hemi (h) and EDTA–CALHM2gap (k).
