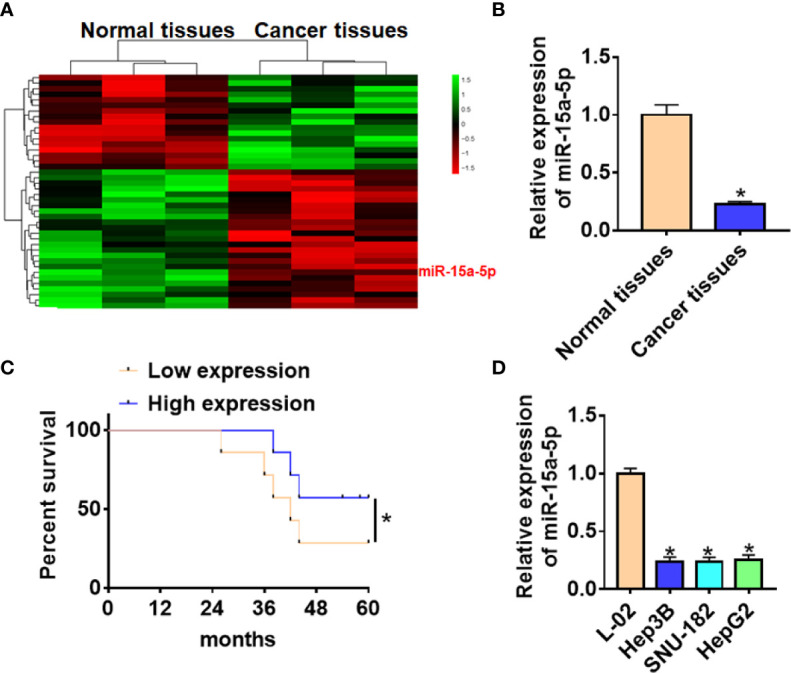
Figure 1.

The expression of miR-15a-5p in CRC tissues and cells. (A) MiRNA expression profiles of normal tissues and cancer tissues in HCC. (B) The expression of miR-15a-5p in normal and cancer tissues was detected by qRT-PCR. n = 40. (C) According to the median level of miR-15a-5p in (B), 40 HCC patients was divided into low (n = 20) and high expression group (n = 20). Kaplan-Meier curves indicated 5-year survival rate of HCC patients. (D) qRT-PCR analysis for miR-15a-5p level in normal human hepatocyte L-02 and HCC cell lines (Hep3B, SNU-182, HepG2). Data are mean ± SD; *P < 0.05.
