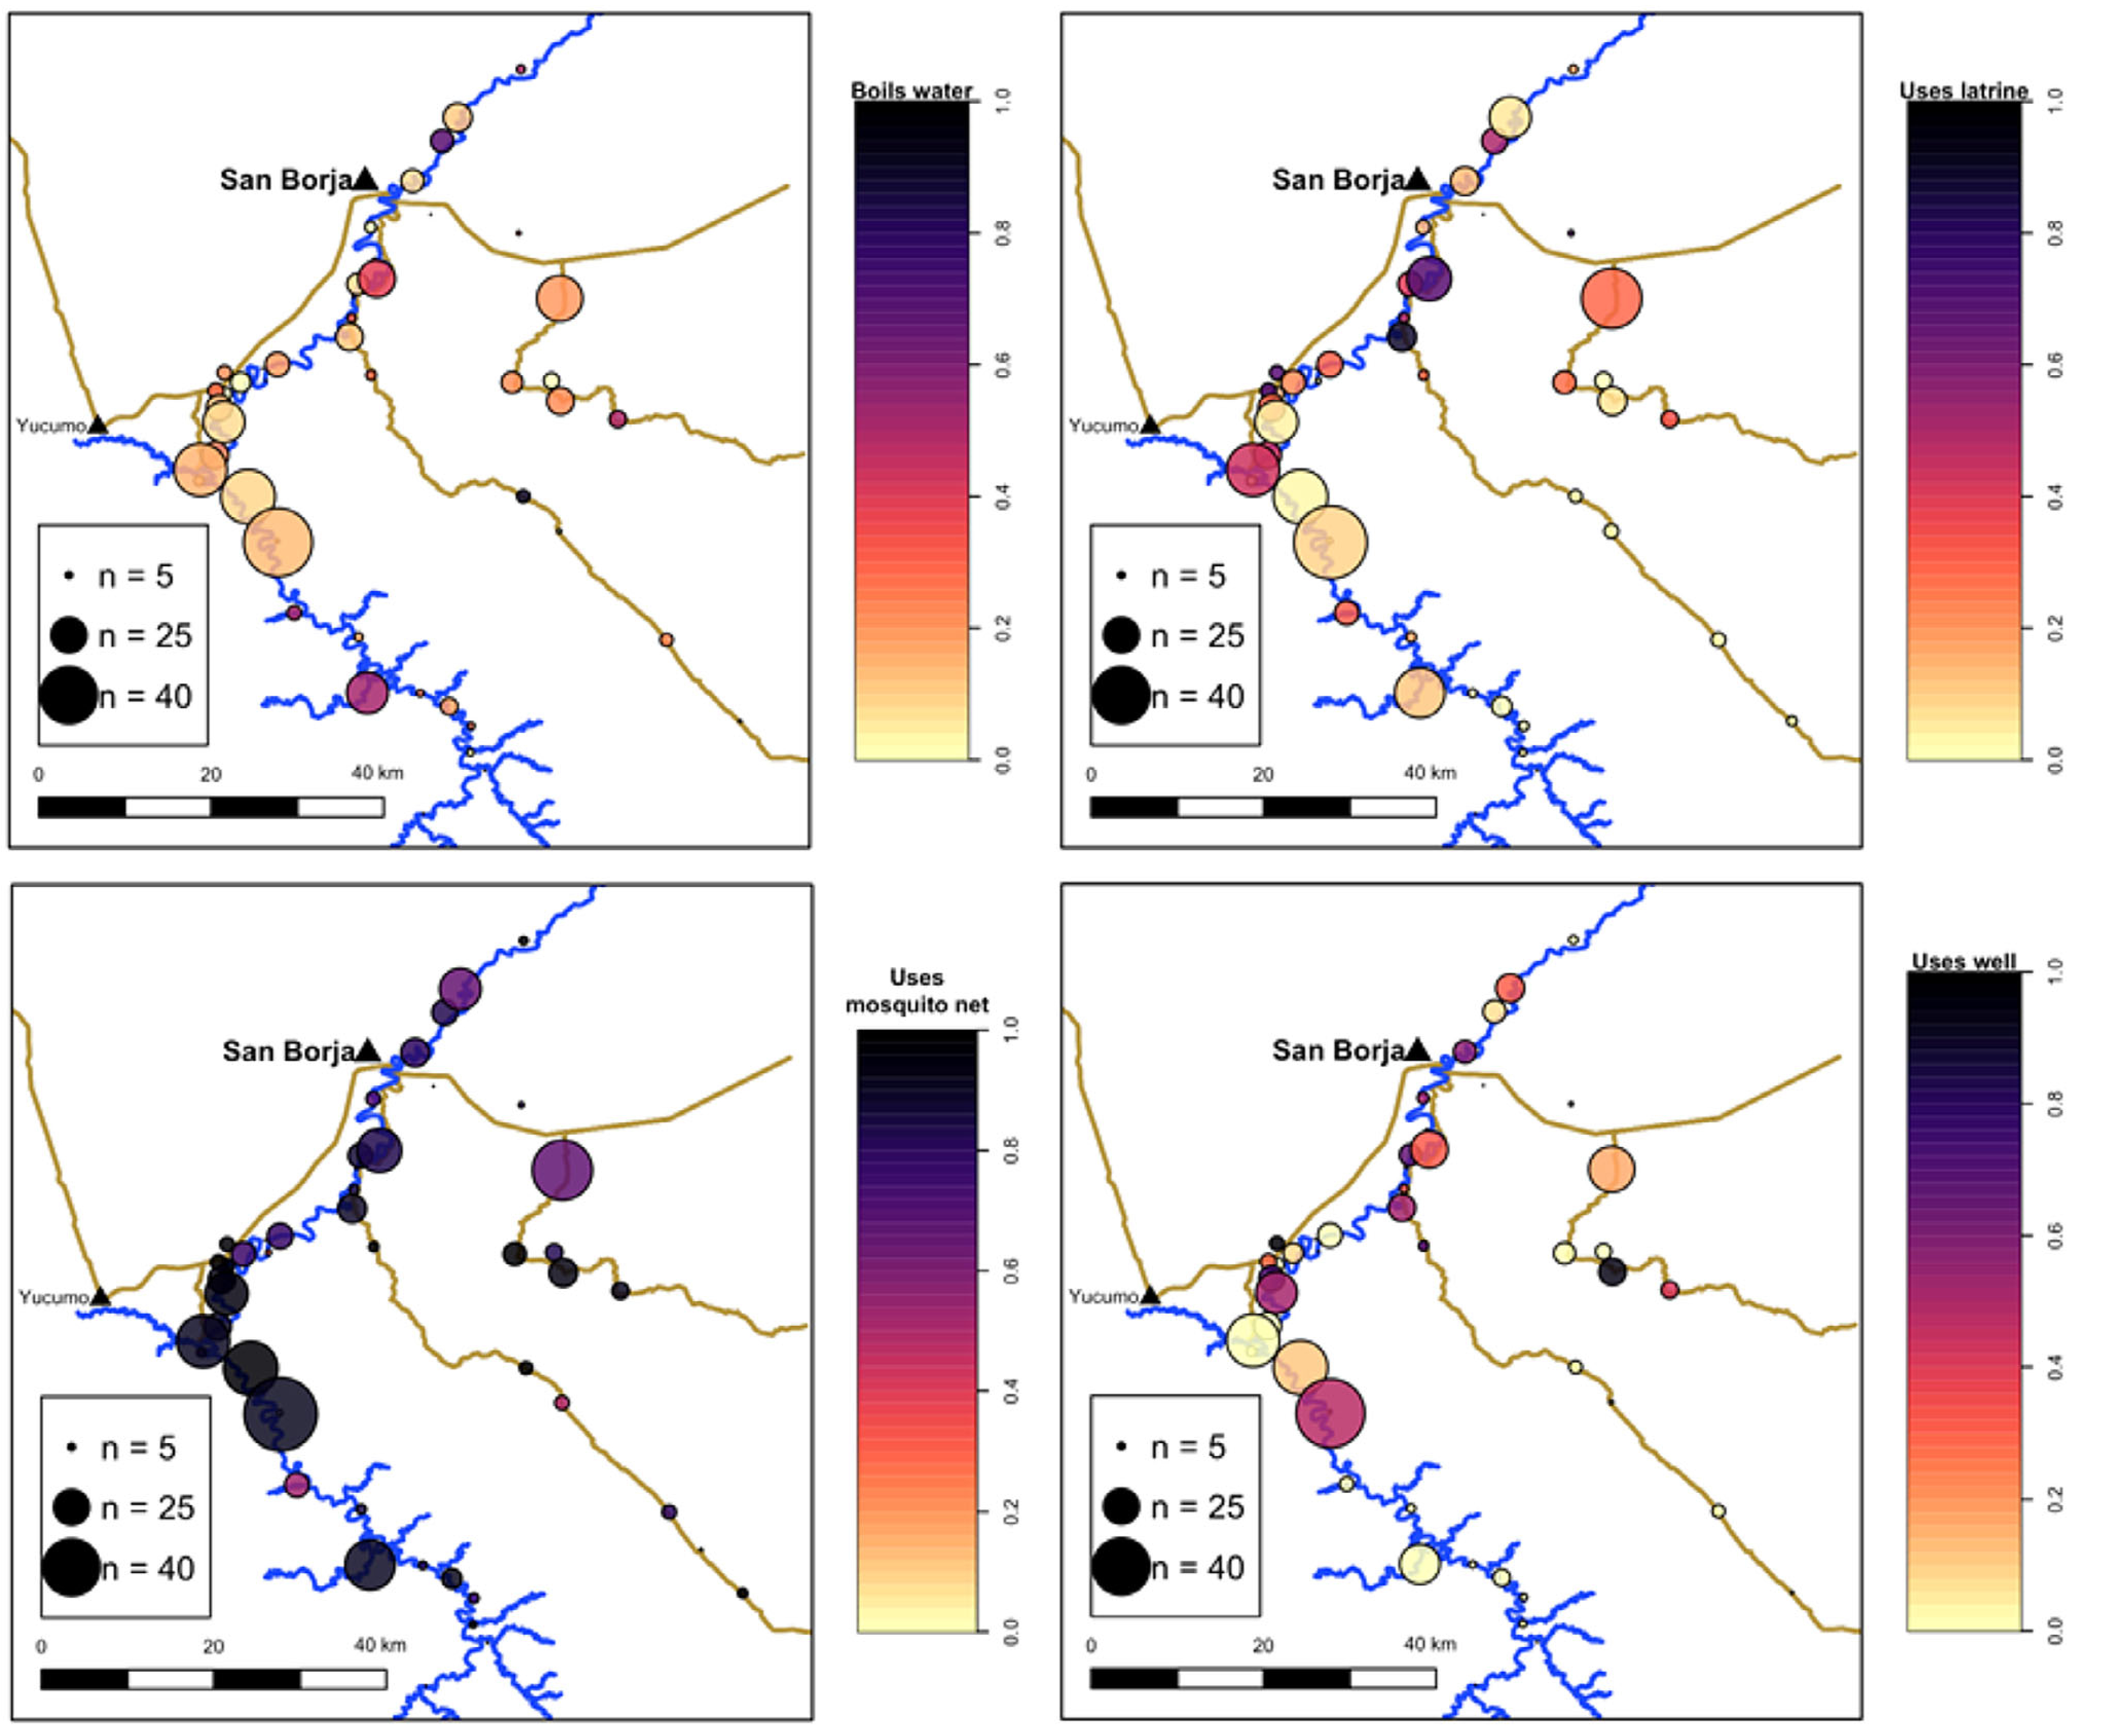
FIGURE 1.

Heat map of health-promoting behaviors across sampled Tsimane communities. The color continuum indicates uptake of health-promoting behavior as the proportion of sampled households per community (light: no uptake; dark: full uptake). Circle size represents sample size per community
