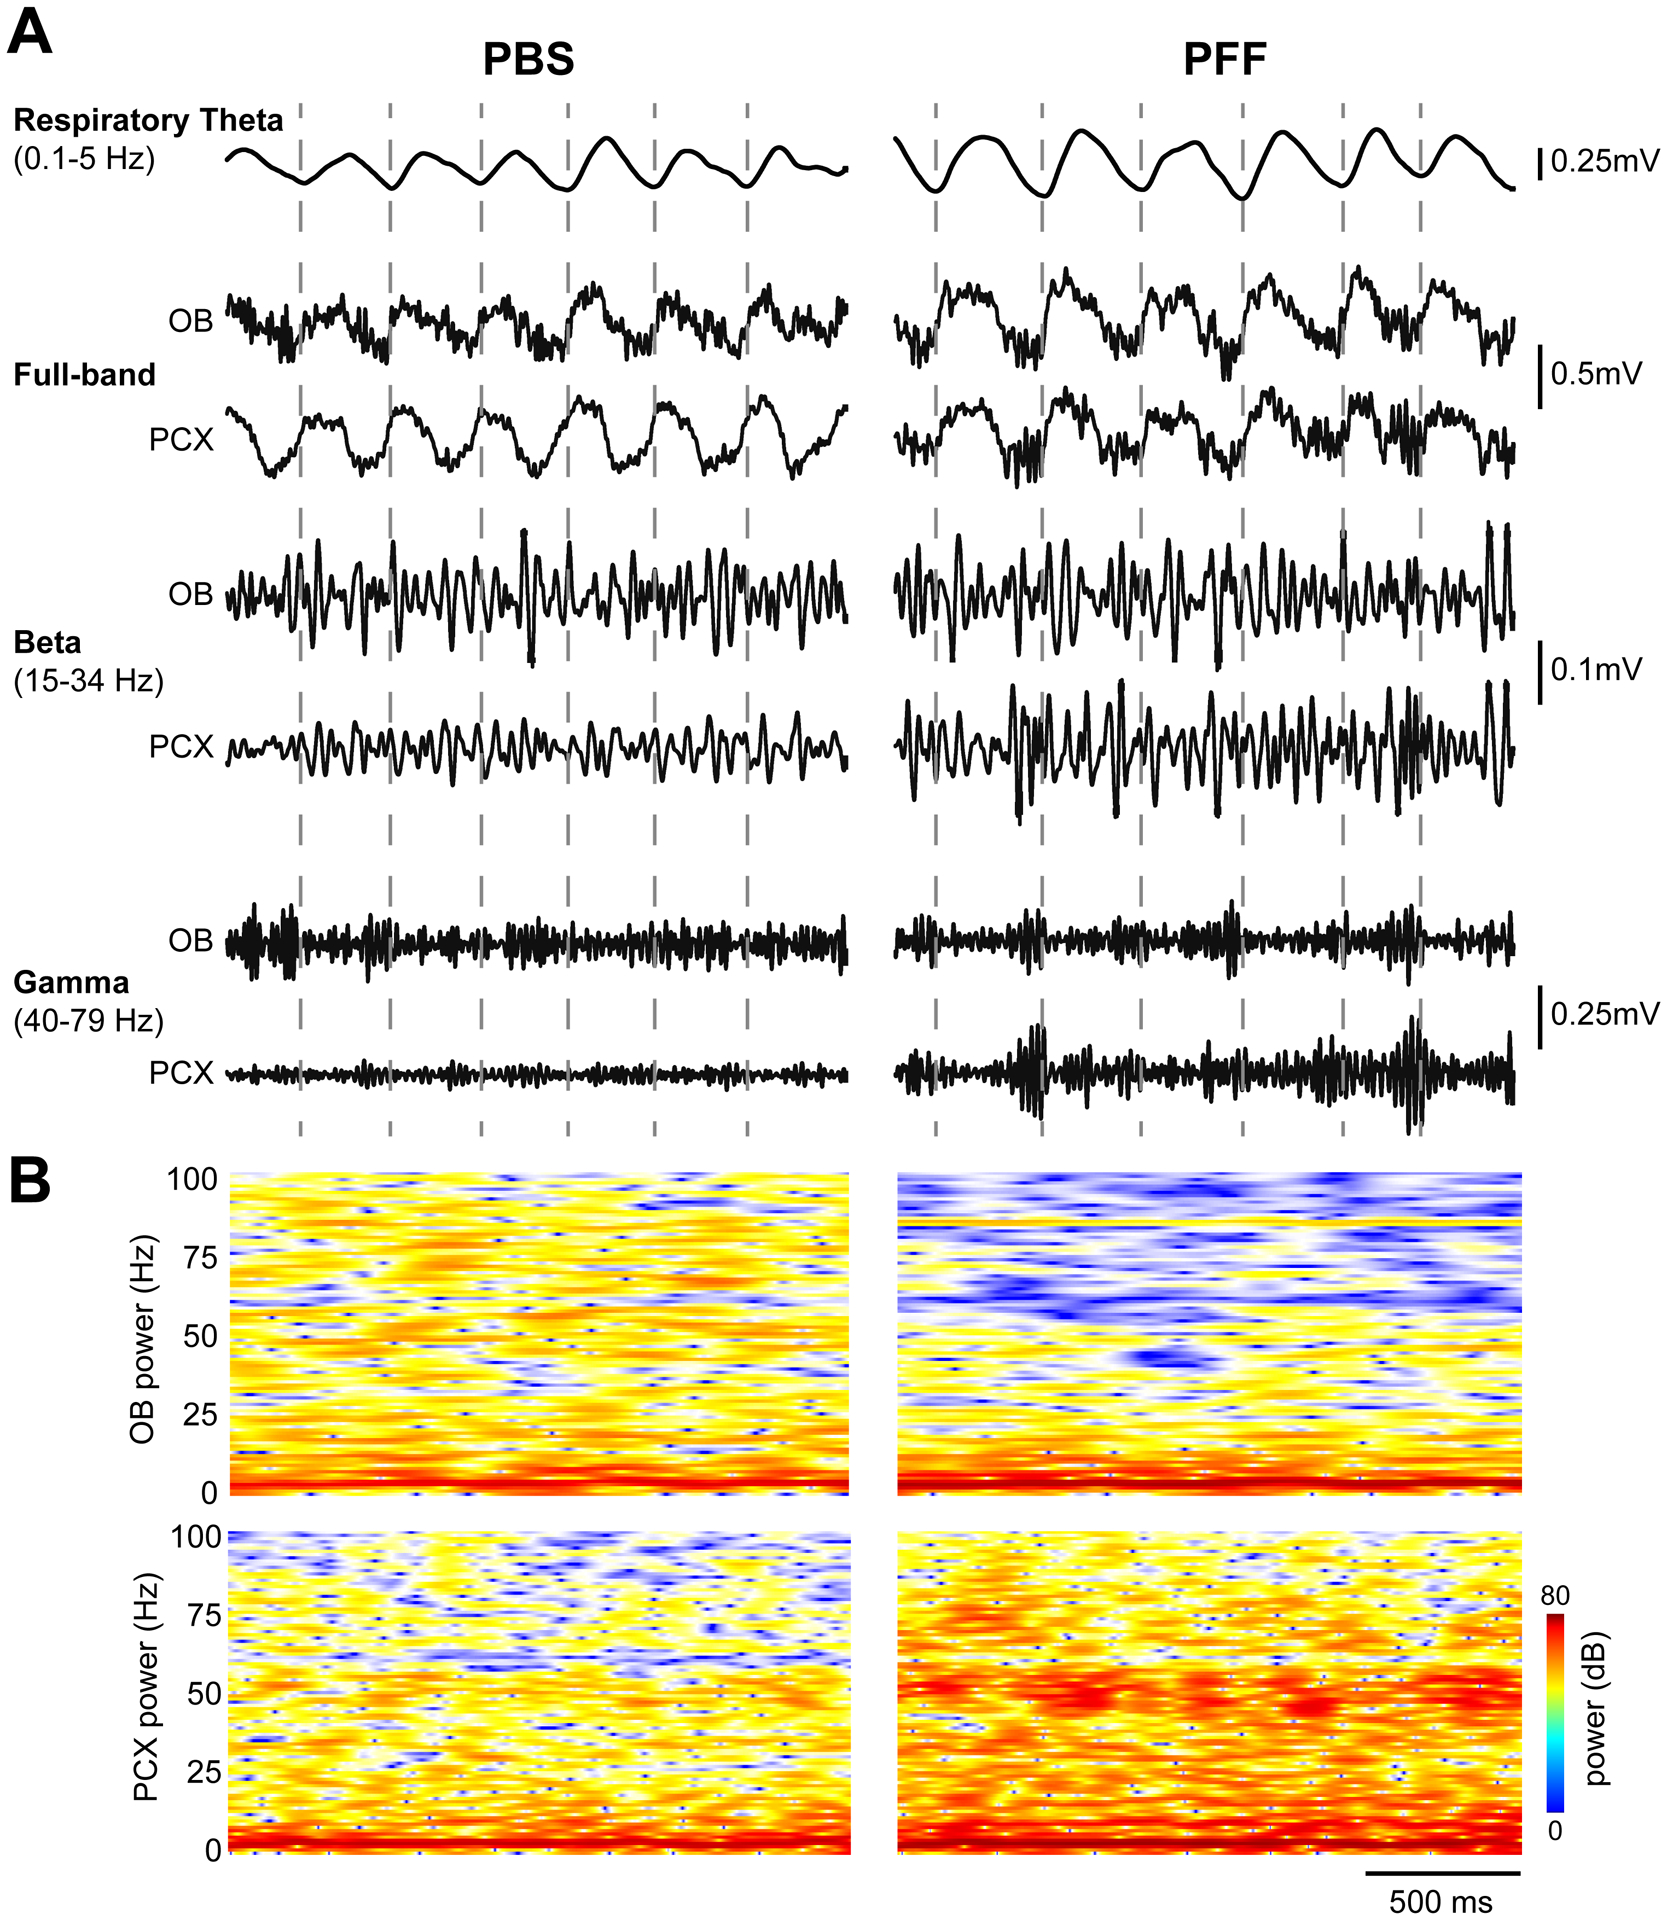
Fig 5. Example spontaneous LFP activity.

A, Representative spontaneous LFP traces from two separate mice injected with either PBS (left) or PFF (right), 2 months prior to recording. Shown are full band traces from simultaneous OB and PCX recordings (0.1–100Hz) which were also filtered to separately display beta and gamma band activity as defined in the figure. Respiratory theta from the OB is also displayed along with dashed vertical lines indicating the timing of OB respiratory cycles for visual aid. B, 2-dimensional histograms of the same spontaneous full band power spectrograms with power displayed in dB to help illustrate the diversity of the full band data.
