Figure 6.
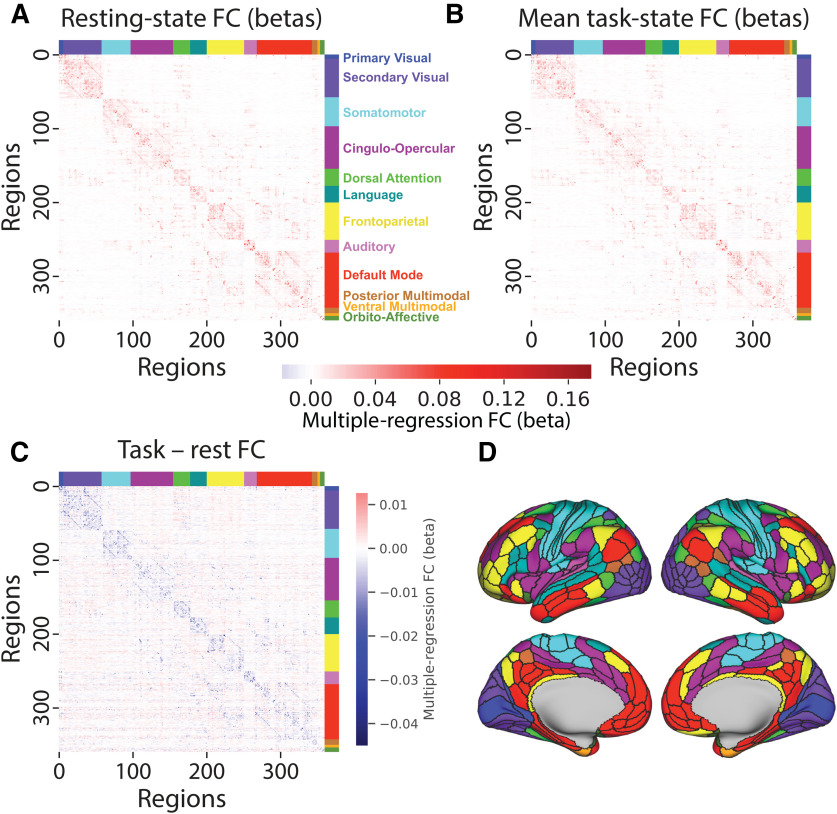
Multiple-regression FC is similar across rest and task, and mostly decreases from rest to task. A, Resting-state multiple-regression FC averaged across N = 176 subjects (discovery set). Network names are listed on the right. B, Mean task-state multiple-regression FC averaged across the 24 task conditions. The similarity between the matrices shown in A and B was r = 0.94. C, Subtraction between data plotted in A and B. Only 2.6% of connections were statistically different from 0. D, A cortical surface plot of the networks listed in A (Ji et al., 2019; available at https://github.com/ColeLab/ColeAnticevicNetPartition).

