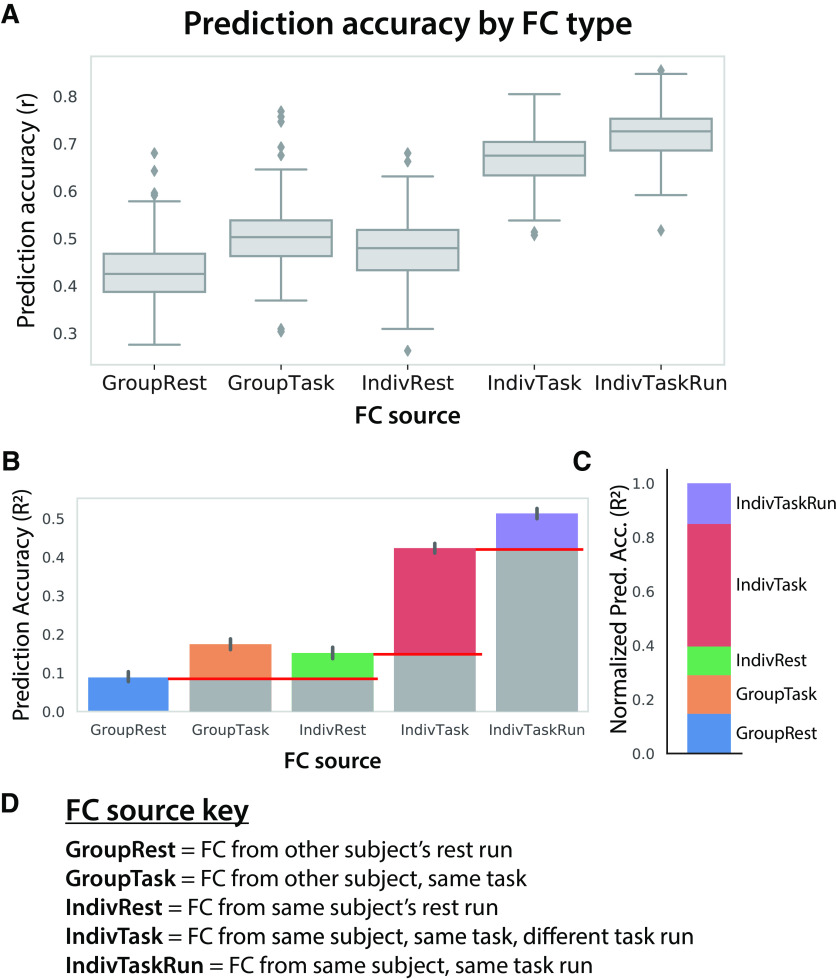
Figure 9.
Intrinsic, individual, task-specific, and task run-specific factors contribute to shaping each individual's task activations. A, Distinct sources of FC were used for activity flow mapping with the same task activations (24 conditions, first run only). The prediction accuracies can be directly compared given that they are predicting the same set of activations (prediction accuracy computed across 360 regions and 24 conditions). B, Prediction accuracies computed as unscaled R2 (not r2) values, which can be interpreted (once multiplied by 100) as the percentage of variance in the to-be-predicted activity pattern explained by the prediction. The red lines indicate baselining to quantify the relative effects in C. C, Same as B, but baselined (as indicated in B) to highlight the relative effects and normalized such that all values add up to 1. This facilitates the interpretation of the role of intrinsic, individual, task, and task run-specific factors in producing task activations. These normalized R2 values can be interpreted as the proportion of the explained variance (in the IndivTaskRun results) contributed to by each factor. D, Detailed descriptions of the FC sources.

