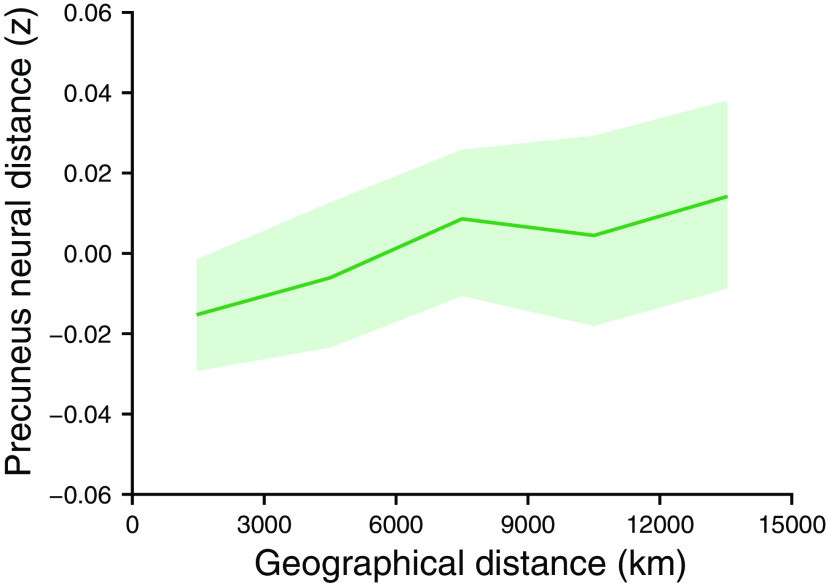
Figure 8.
Geographical distance coding in precuneus. Average neural distance between activation patterns observed during presentation of places increased as a function of the geographical distance between them. The neural distance measure controls for visual similarity and semantic similarity. Error bars indicate 95% CIs. The analysis used to select this region is not independent from the relationship plotted here, so effect sizes may be inflated.

