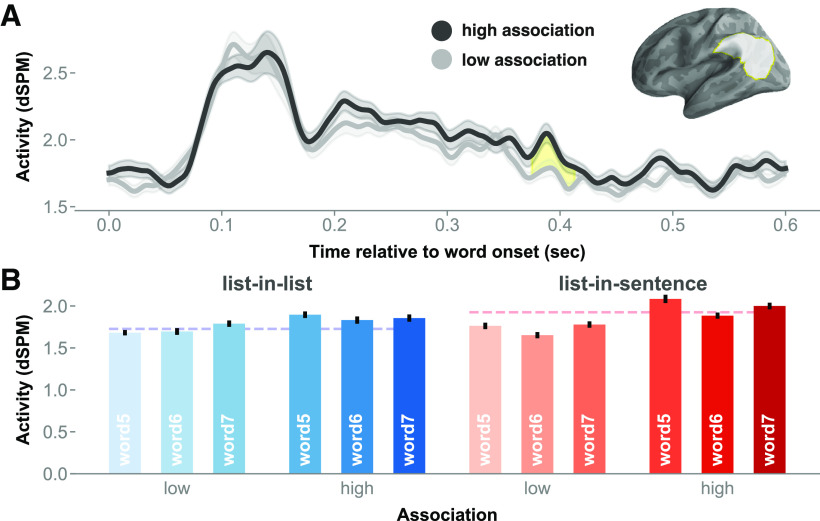
Figure 8.
Main effect of association in the left PTL. A, Chart of the activity time course in the left TPJ, with cluster extent shaded in yellow. B, The red-blue bar graphs, breaking down the effect of association by the full design. Error bars represent 1 within-subjects SEM (Loftus and Masson, 1994).

