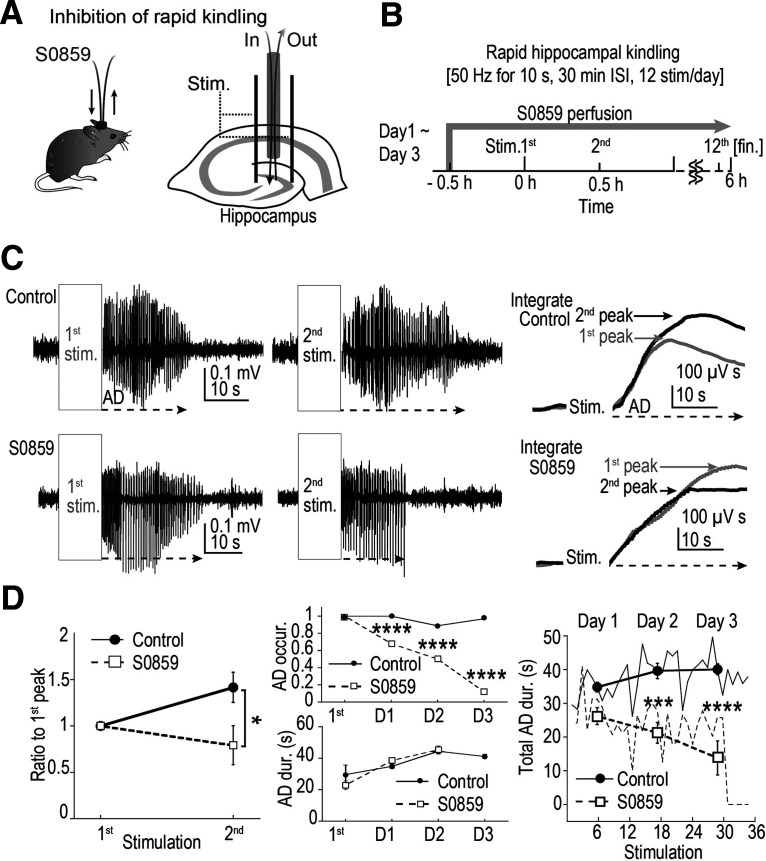
Figure 5.
NBC blocker suppressed in vivo rapid hippocampal kindling. A, Diagram of the method for intrahippocampal application of S0859 during rapid kindling. A microdialysis probe with semipermeable membrane was used, and ACSF continuously flowed through the probe (gray). When S0859 was added to the ACSF, S0859 would be directly applied to the brain parenchyma by permeating through the tip membrane. Electrical stimulations to the hippocampus were delivered between the two implanted electrodes (black bars shown as Stim.). B, Experimental time courses of rapid hippocampal kindling. ACSF or ACSF supplemented with 300 μm S0859 was applied through the probe 30 min before the first stimulation. The solution application lasted for ∼6 h until end of the 12th stimulation. A train stimulus consisted of 1-ms-duration pulses at 20 ms ISI (50 Hz) 500 times (10 s), which was repeated at 30 min interval 12 times/d. Approximately 6 h of such experiments were repeated for 3 consecutive days. C, Top, Stimulation-induced ADs were often more severe for the second (black) stimulation compared with the first one (gray) in control. Arrows represent the duration of ADs. Bottom, This acute increase in the severity of the stimulation-induced ADs was often not observed when the S0859 was applied. Right, For the traces shown in the middle panel, absolute values of the EEG traces were first integrated and the linear increase in the integral because of the baseline noise was subtracted. The first (gray) and the second (black) integrated ADs calculated from the left original traces are shown. The peak of the second integrated peak was larger than the first in control, but in S0859, the increase in the integrated peak was often not apparent. D, Left, The peak of the integrated AD was measured, and the ratio of the peak to that from the first stimulation was calculated (mean ± SEM). The integrated AD ratio increased for the second stimulus in control; however, the increase was not present when S0859 was applied (*p < 0.05, n = 6 animals each, Student's t test). Middle panels, Averaged AD occurrence rates (top) and durations (bottom). Note that ADs were always evoked by the first stimulation in all mice shown, as mice that did not exhibit an AD with the fixed stimulation strength were omitted for further analysis. In the presence of S0859, AD occurrence dropped significantly during multiple days of stimulation. However, when AD did occur, the AD duration increased with each day of stimulation as in control (n = 5–6 animals each; χ2 = 27.4, 24.5, 91 for days 1, 2, 3, respectively; ****p < 0.0001, χ2 test). Note that AD duration was calculated only when AD occurred. By day 3 (D3), in the presence of S0859, most stimulation failed to produce an AD in all animals tested. Therefore, AD duration was not calculated for D3 for S0859 condition. Right, AD durations (including AD = 0) in response to each stimulation (total, 36 stimulations; 12 stim./d for 3 d) were averaged across all animals in the control group and the S0859 group, respectively (n = 5–6 animals each; shown as lines). Daily averages were also calculated for each group and are shown as symbols (***p < 0.001, ****p < 0.0001, daily averages of control vs S0859 group, Mann–Whitney U test).

