Figure 2.
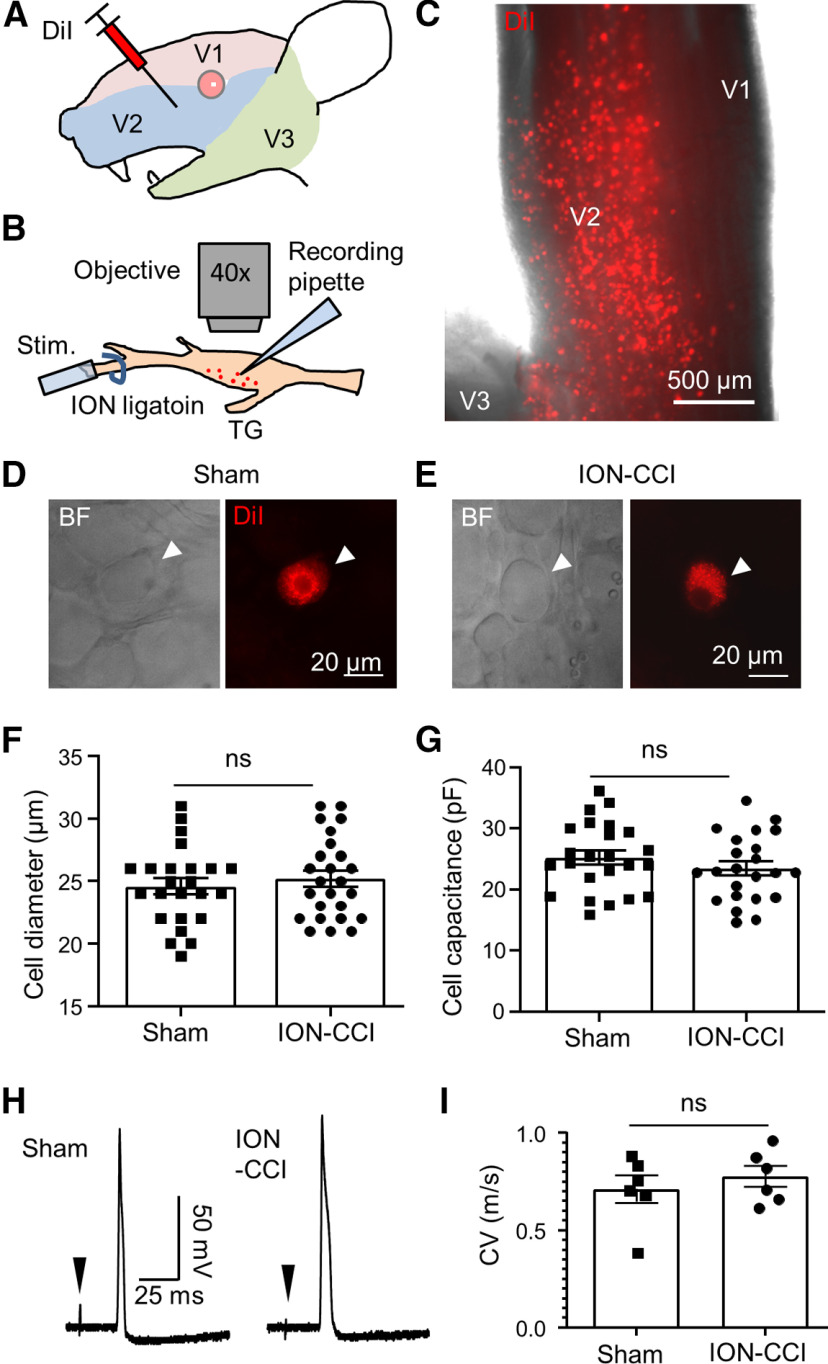
Patch-clamp recordings from small-sized V2 TG neurons innervating orofacial cutaneous regions of the sham and the ION-CCI rats. A, Illustration of intracutaneous injection of DiI in orofacial (V2) regions. The injections were performed in the sham or the ION-CCI group 5–7 d before patch-clamp recording experiments. B, Illustration of patch-clamp recordings from DiI-labeled orofacial cutaneous afferent neurons in the whole-mount ex vivo TG preparations. The relative positions of recording site, nerve ligation site, and stimulation site are indicated. C, Image captured under a fluorescent microscope with a 5× object shows the distribution of DiI-labeled neurons in the V2 region of a fresh TG. D, Bright field image (left) and fluorescent image (right; DiI) show in the same field a small-sized DiI-labeled V2 TG neuron (arrow indicated) in a whole-mount ex vivo TG preparation of the sham group. Patch-clamp recording was applied to the TG neuron. E, Similar to D except the TG preparation was from the ION-CCI group. F, G, Diameters (F) and membrane capacitance (G) of the small-sized DiI-labeled V2 TG neurons in ex vivo TG preparation of the sham (n = 24) and the ION-CCI groups (n = 26) included in the patch-clamp recording experiments. H, A sample trace of an AP recorded from a small-sized DiI-labeled V2 TG neuron of the sham group (left) and another sample trace of an AP recorded from a small-sized DiI-labeled V2 TG neuron of the ION-CCI group. Arrow in each trace indicates stimulation artifact. I, Summary data of conduction velocities of APs propagated from peripheral stimulation sites on afferent nerve fibers to the recording sites on the somas of the small-sized DiI-labeled V2 TG neurons. Open bar, sham group (n = 6); closed bar, ION-CI group (n = 6). Data represent mean ± SEM; NS, no significant difference.

