Figure 1.
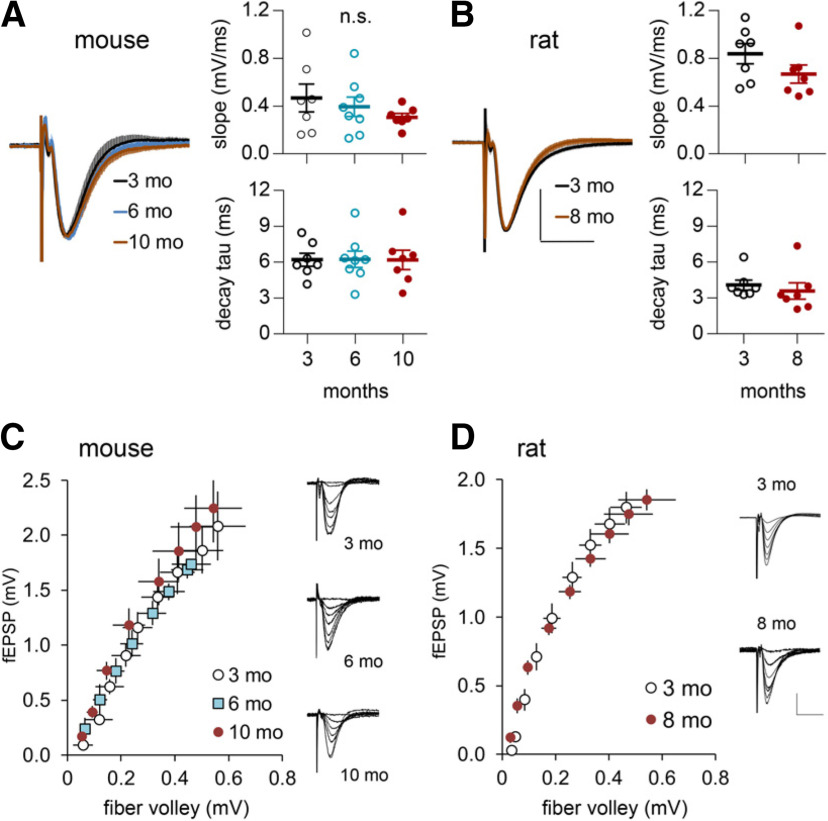
Waveforms of LPP fEPSPs are comparable in early and later adulthood. A, B, Responses from individual slices were normalized to their peak amplitude and then averaged across all slices within a group. At left, mean ± SEM traces for the different age groups were superimposed for mouse (3-month-old, N = 8; 6-month-old, N = 9; 10-month-old, N = 7; A) and rat (3-month-old, N = 7; 8-month-old, N = 7; B); there were no obvious differences between 3-month-old and older rodents. Calibration: (in B) A, B, 50% peak fEPSP amplitude, 10 ms. At right, graphs show the initial slopes, and decay time constants (tau) did not differ between young and older mice (A; slope: p = 0.431; decay tau: p = 0.999, one-way ANOVA; 3-month-old, N = 7; 6-month-old, N = 8; 10-month-old, N = 7) and rats (B; slope: p = 0.159, t test; decay tau: p = 0.5406; 3-month-old, N = 7; 8-month-old, N = 7). C, D, Input/output (fiber volley vs fEPSP amplitude) curves were comparable across ages in mice (C; 3-month-old, N = 5; 6-month-old, N = 6, 10-month-old, N = 5) and rats (D; 3-month-old, N = 7; 8-month-old, N = 8); traces for the different age groups are shown at right. Calibration: (in D) C, D, 1 mV, 10 ms.

