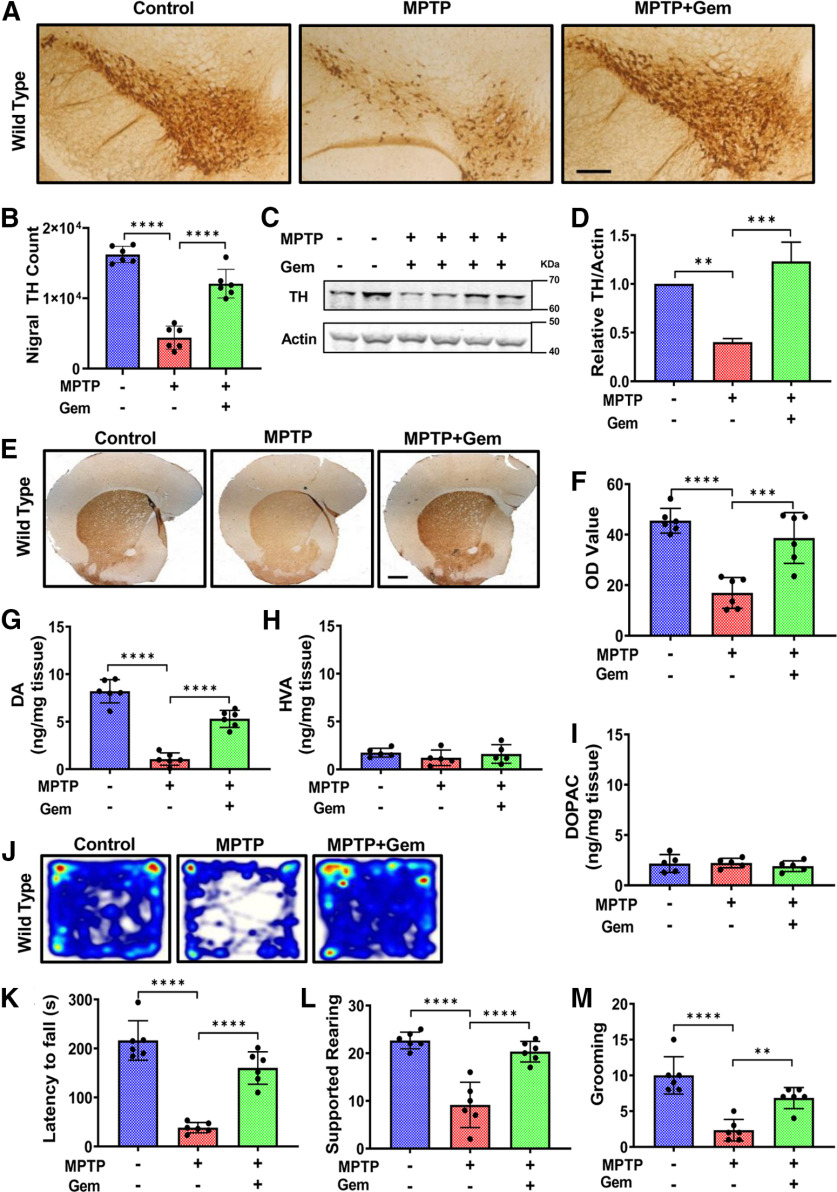
Figure 1.
Gemfibrozil rescues nigrostriatal pathology in MPTP mouse model of PD. The 6- to 8-week-old C57BL/6 mice (n = 6 per group) were lesioned with MPTP (20 mg/kg body weight/injection, four intraperitoneal injections at 2 h intervals). At 4 h following the last MPTP injection, mice were fed gemfibrozil (7.5 mg/kg body weight/d) via oral gavage for 7 d. A, B, Before being killed on day 7, all of the animals were subjected to behavioral assay. A, B, Representative TH immunostaining (A), and stereological counting (B) of nigral TH neurons. Results are the mean ± SEM of six animals per group with the significance of the mean tested by one-way ANOVA (F(2,15) = 78.69 > F-critical (Fc) = 3.68) ****p < 0.0001). A post hoc Sidak's pairwise test results in ****p < 0.0001 for control versus MPTP, and ****p < 0.0001 for MPTP versus MPTP + gemfibrozil (Gem). C, D, TH protein concentration in the nigra was visualized via immunoblot (C) and quantified using densitometry (D). Results are the mean ± the SEM of three independent immunoblots with significance of the mean tested by one-way ANOVA (F(2,6) = 40.71 > Fc = 5.14; ***p = 0.0003), followed by a post hoc Sidak's test, resulting in **p = 0.0015 for control versus MPTP, and ***p = 0.0002 for MPTP versus MPTP + Gem. E, F, Representative immunostaining to visualize TH fiber in the striatum (E) and corresponding optical density analyses (F). Results are the mean ± the SEM of six level-matched striatal sections per animal. Significance of the mean was tested by a one-way ANOVA (F(2,15) = 24.76 > Fc = 3.68; ****p < 0.0001), followed by a post hoc Sidak's test between the groups resulting in ****p < 0.0001 for control versus MPTP, and ***p = 0.0002 for MPTP versus MPTP + Gem. G–I, Analysis of DA (G), HVA (H), and DOPAC (I) in striatum. Results are the mean ± SEM of six animals per group with significance of the mean tested by ANOVA that results, for striatal dopamine (DA) concentrations in F(2,15) = 84.87 > Fc = 3.89 (****p < 0.0001). A post hoc Sidak's test results in ****p < 0.0001 for control versus MPTP, and ****p < 0.0001 for MPTP versus MPTP + Gem. No significant differences were observed in HVA or DOPAC levels among the groups. J, Representative heat map from the open field analysis. K, Rotarod analysis measuring latency to fall. Results are the mean ± SEM of six animals per group, with the significance of the mean tested by one-way ANOVA (F(2,15) = 52.52 > Fc = 3.89; ****p < 0.0001), followed by a Sidak's test resulting in ****p < 0.0001 for control versus MPTP, and ****p < 0.0001 for MPTP versus MPTP + Gem. L, Supported rearing counts; one-way ANOVA (F(2,15) = 30.93 > Fc = 3.89; ****p < 0.0001), post hoc Sidak's test resulting in ****p < 0.0001 for control versus MPTP and ****p < 0.0001 for MPTP versus MPTP + Gem. M, Grooming counts; one-way ANOVA (F(2,15) = 23.78 > Fc = 3.89; ****p < 0.0001), post hoc Sidak's test resulting in ****p < 0.0001 for control versus MPTP and **p = 0.0022 for MPTP versus MPTP + Gem.

