
Figure 1.
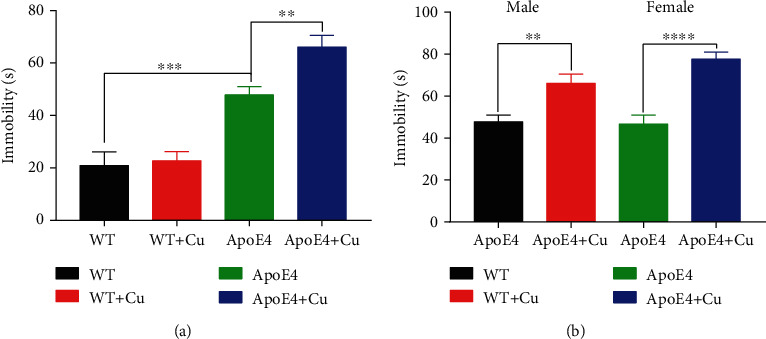
The 4 months of low-dose copper exposure on depression-like behavior in mice. (a, b) The percentage of immobility time. The data was shown as mean ± SEM. ∗∗p < 0.01, ∗∗∗p < 0.001, and ∗∗∗∗p < 0.0001. n = 10-12 for each group.
Official websites use .gov
A
.gov website belongs to an official
government organization in the United States.
Secure .gov websites use HTTPS
A lock (
) or https:// means you've safely
connected to the .gov website. Share sensitive
information only on official, secure websites.
The 4 months of low-dose copper exposure on depression-like behavior in mice. (a, b) The percentage of immobility time. The data was shown as mean ± SEM. ∗∗p < 0.01, ∗∗∗p < 0.001, and ∗∗∗∗p < 0.0001. n = 10-12 for each group.