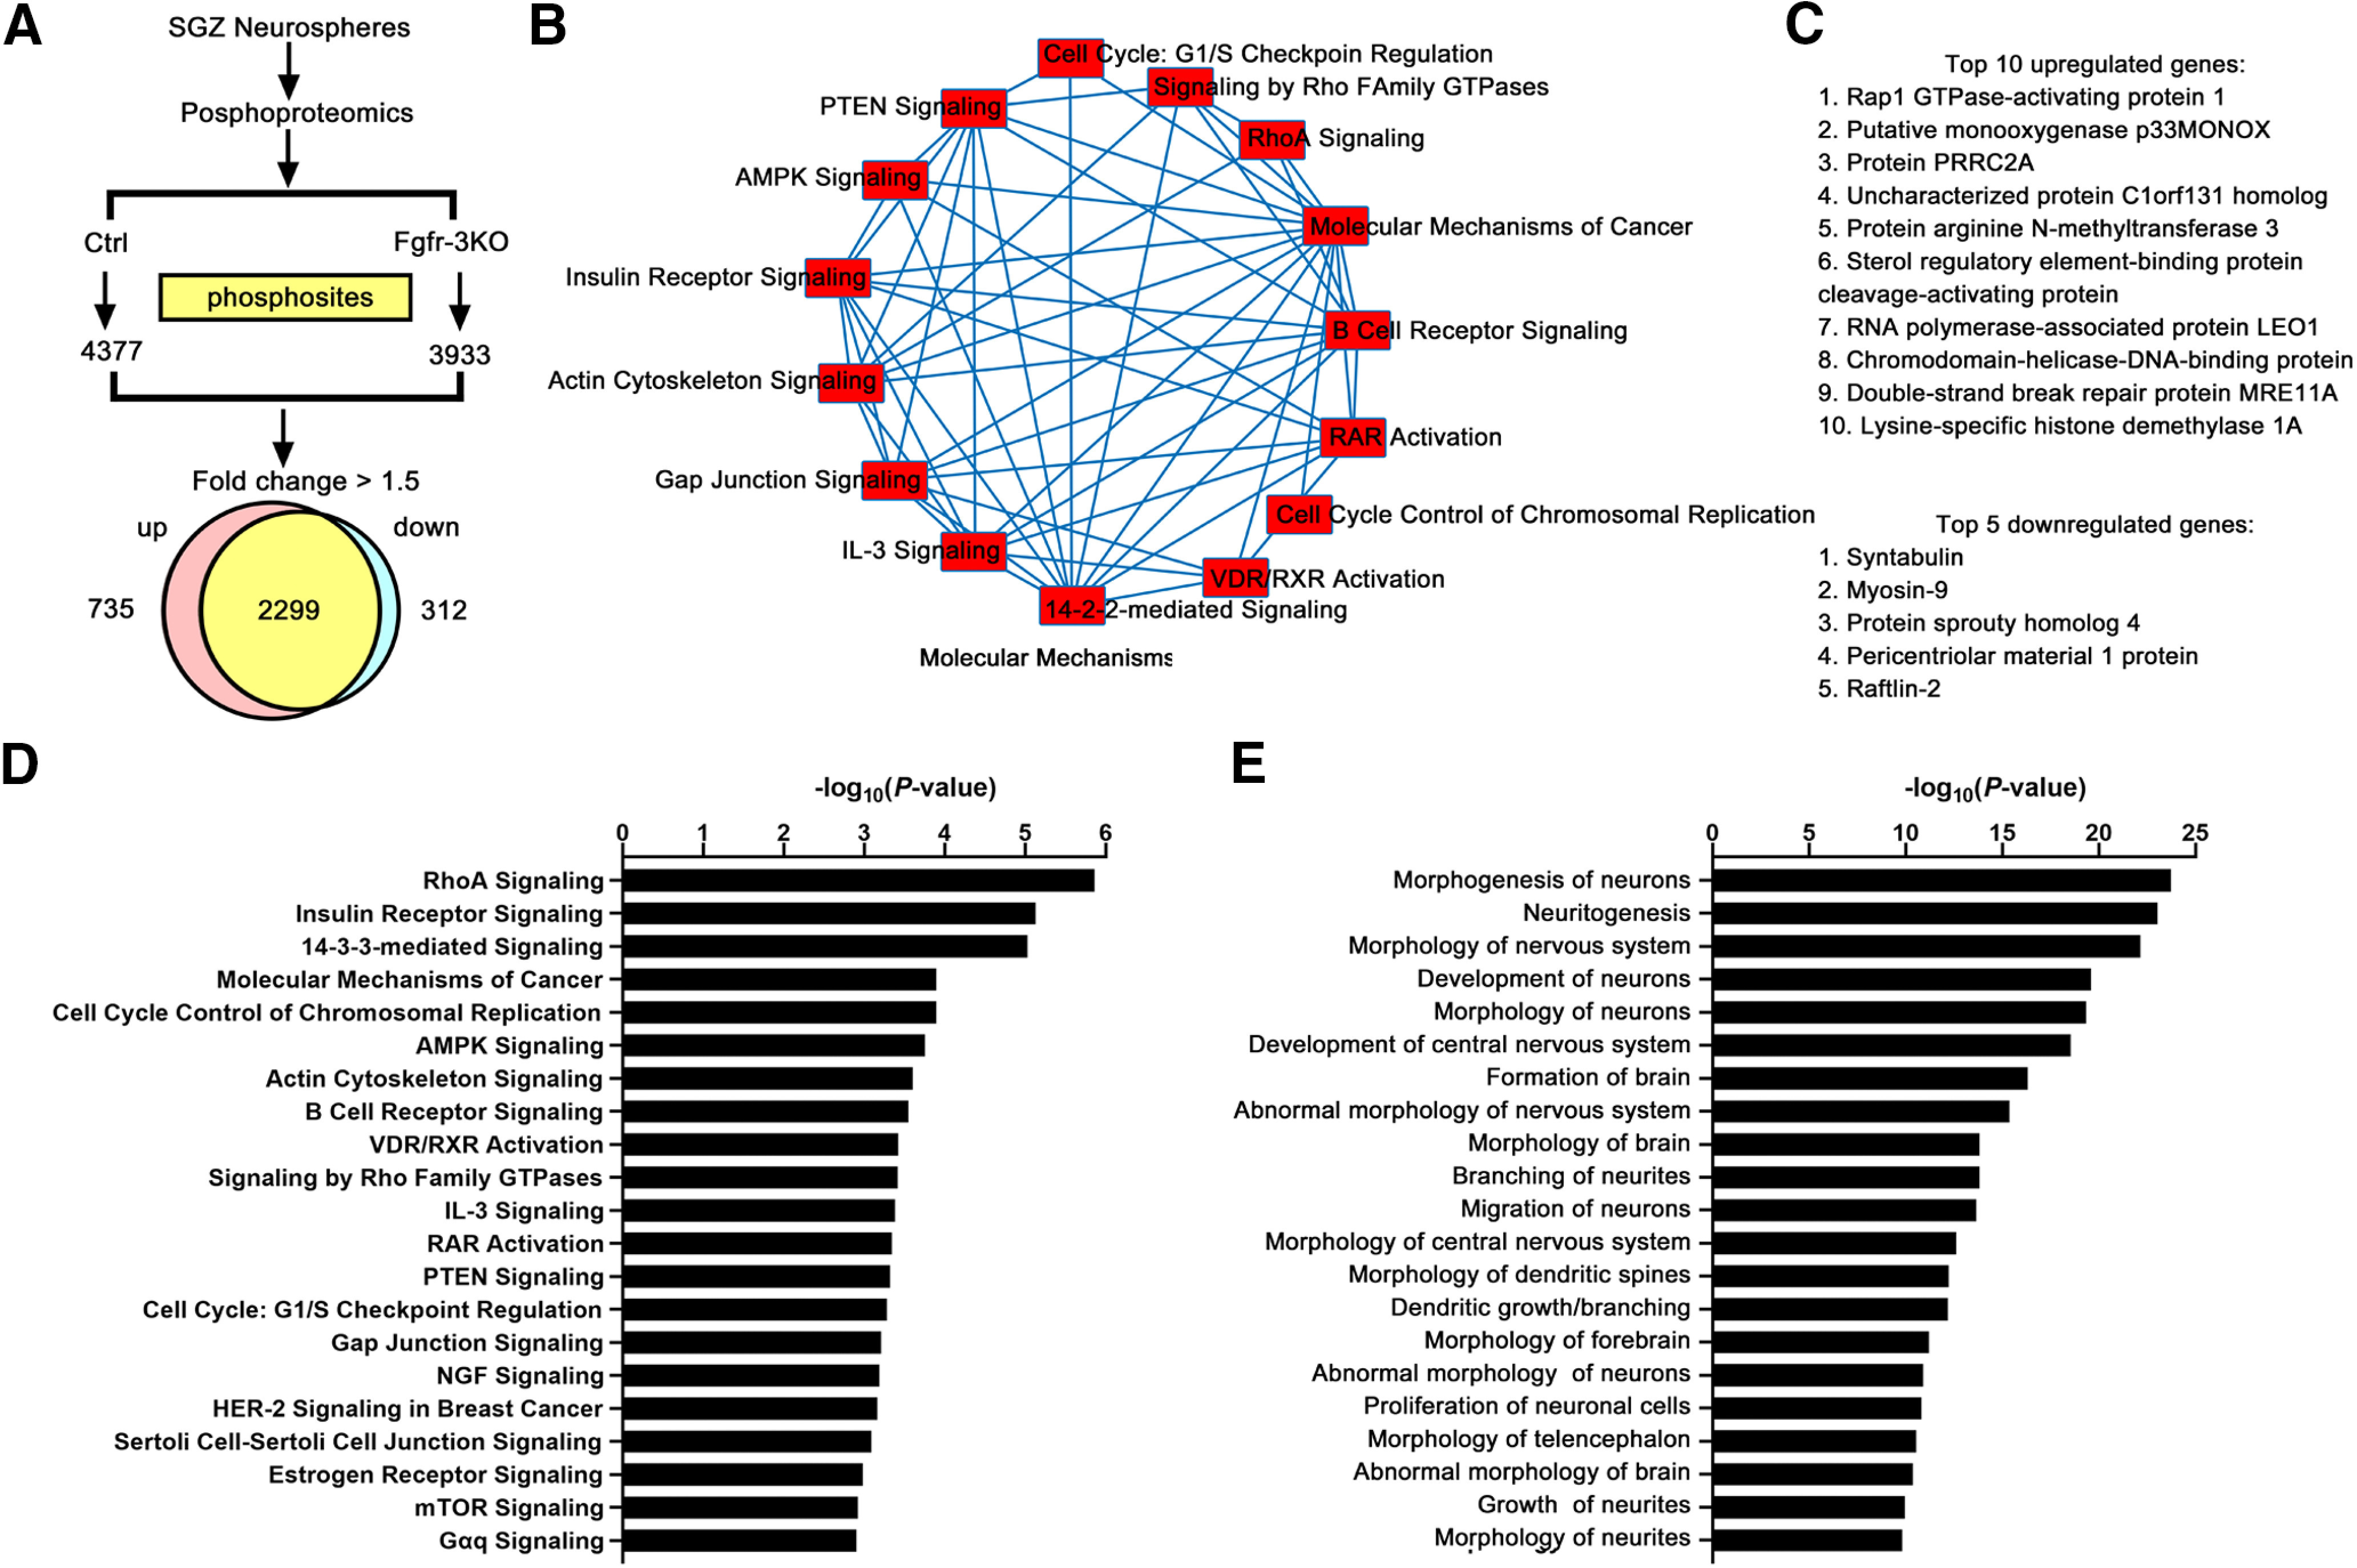
Figure 10.

Phosphoproteomics analysis of Fgfr-3KO mice. A, Numbers of phosphosites in control and Fgfr-3KO SGZ neurospheres and the number of genes with phosphorylated sites that were upregulated or downregulated at least 1.5-fold. To reduce variability, neurosphere preparations with the same triple-mutant genotype were split in two, with one-half receiving 4-HO-tamoxifen for 24 h (Fgfr-3KO), and the other half receiving no 4-HO-tamoxifen (Control). B, Top, Fifteen molecular pathways with differentially phosphorylated proteins. C, Top 10 upregulated and top 5 downregulated genes. D, Major signaling pathways identified for all tissue types. E, Nervous system-specific categories with p values > 2.5. AMPK, Adenosine 5′ monophosphate-activated protein kinase; RAR, retinoic acid receptor; RXR, retinoic X receptor.
