Figure 11.
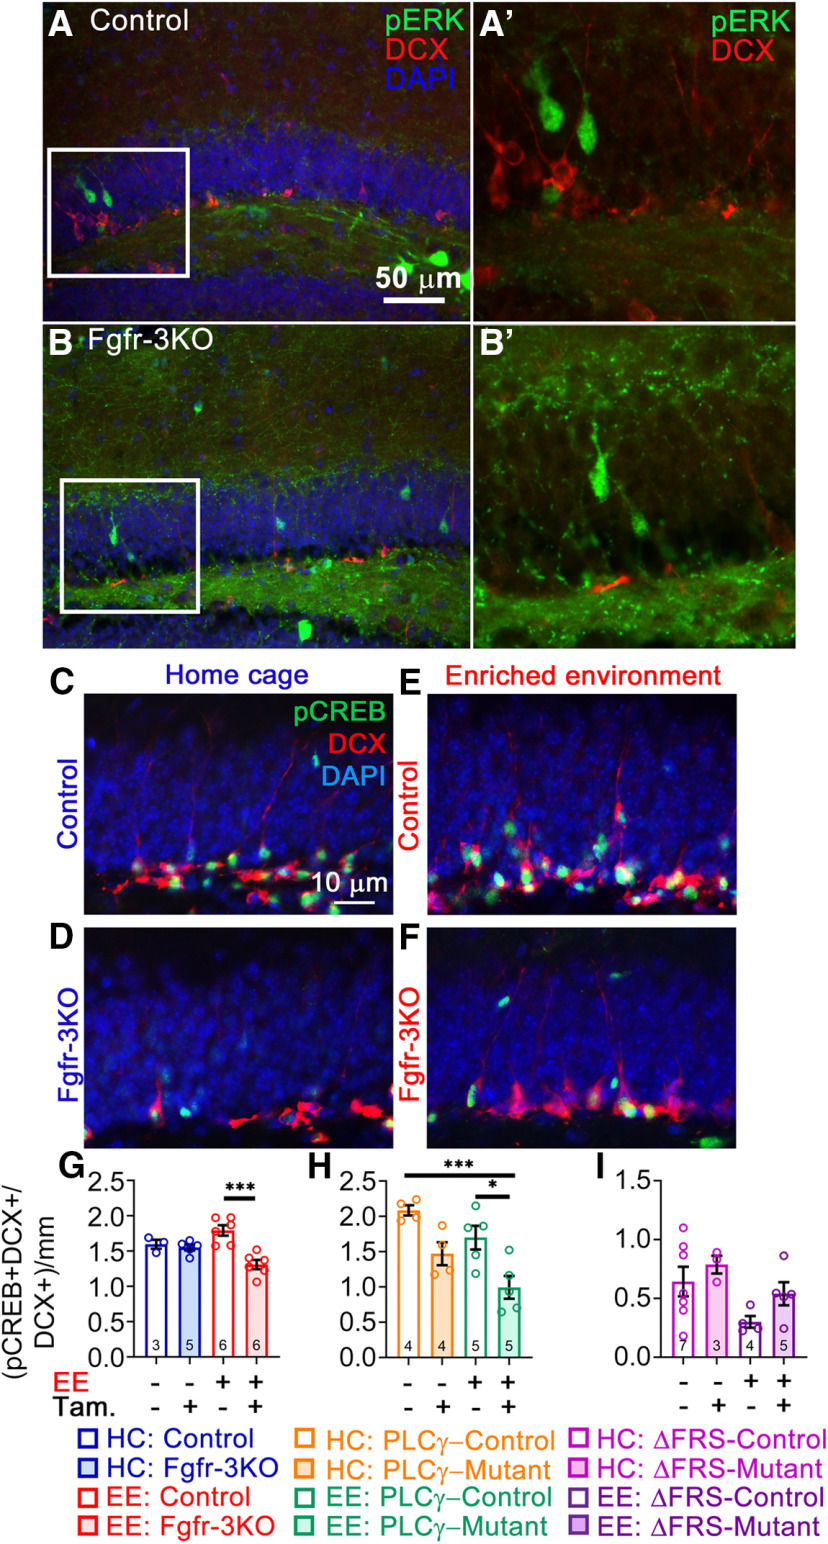
Phosphorylation of CREB, central to neural differentiation, is regulated by EE-induced FGFR signaling. Immunofluorescent staining for pERK showed no colocalization with DCX+ cells, only staining cells in the granule cell layer removed from the SGZ at 5 weeks post-tamoxifen (Tam) injection. A, A′, control (A) and enlarged view of boxed area in A (A′). B, B′, fr-3KO (B) and enlarged view of boxed area in B (B′). C–I, All mice are Nestin-CreER;Fgfr1fx/fx;Fgfr2fx/fx;Fgfr3fx/fx and were administered either tamoxifen (+) or corn oil vehicle (–). C–F, Immunostains for pCREB (green) and DCX (red) with DAPI (blue) of control and Fgfr-3KO mice in home cages (C, D) or in EE (E, F). G–I, Quantification of the fraction of DCX+ cells that are pCREB+. F, Control and Fgfr-3KO. Main effect of housing: F(1,16) = 0.1153, p = 0.7386; main effect of genotype: F(1,20) = 14.70, p = 0.0015; interaction: F(1,16) = 10.08, p = 0.0059; ***p = 0.0002. H, Control and FGFR-PLCγ. Main effect of housing: F(1,14) = 7.895, p = 0.0139; main effect of genotype: F(1,14) = 18.46, p = 0.0007; interaction: F(1,14) = 0.0866, p = 0.7729; ***p = 0.0009, *p = 0.0184, ***p = 0.0009. I, Control and FGFR-ΔFRS. Main effect of housing: F(1,14) = 2.286, p = 0.1528; main effect of genotype: F(1,14) = 2.105, p = 0.1688; interaction: F(1,14) = 0.1.375, p = 0.2606. Each circle represents a mouse (total number of mice is indicated in each bar). Two-way ANOVA with Tukey's post hoc test. Values are the mean ± SEM. HC, Home cage.

