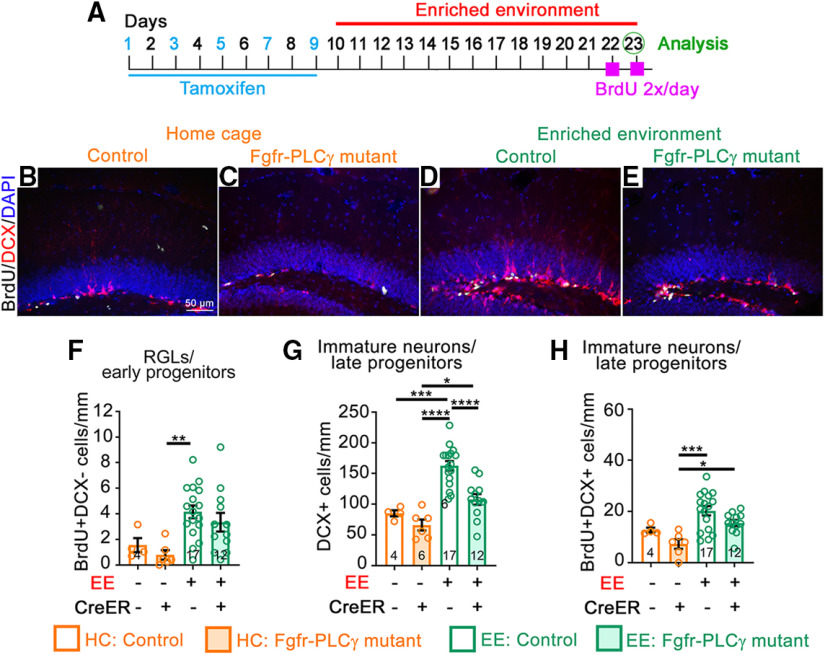
Figure 9.
FGFR signaling through PLCγ is required for the effects of EE on late precursors. A–H, Experimental timeline (A) for B–H. All mice received tamoxifen. B–E, Immunostains of the DG of mice in home cages (HCs; B, C); and EE (D, E), control (B, D), and Fgfr-PLCγ (C, E). BrdU, White; DCX, red; DAPI, blue. Scale bar, 50 µm. F, Number of BrdU+DCX– RGL/early progenitor cells for control and Fgfr-PLCγ mice in home cages (orange) and EE (green). Main effect of housing: F(1,35) = 11.47, p = 0.0018; main effect of genotype: F(1,35) = 1.076, p = 0.3068; interaction: F(1,35) = 0.00177, p = 0.9667; **p = 0.0071. G, Number of DCX+ immature neurons/late progenitors; main effect of housing: F(1,35) = 30.36, p < 0.0001; main effect of genotype: F(1,35) = 11.67, p = 0.0016; interaction: F(1,35) = 2.738, p = 0.1070; *p = 0.0324, ***p = 0.0002, ****p < 0.0001. H, Number of DCX+BrdU+ cells. Main effect of housing: F(1,35) = 12.87, p = 0.0010; main effect of genotype: F(1,35) = 5.421, p = 0.0258; interaction: F(1,35) = 0.0204, p = 0.8874; *p = 0.0404, ***p = 0.0003. Each circle represents a mouse (total number of mice is indicated at the bottom of each bar). Two-way ANOVA with Tukey's post hoc test. Values are the mean ± SEM.

