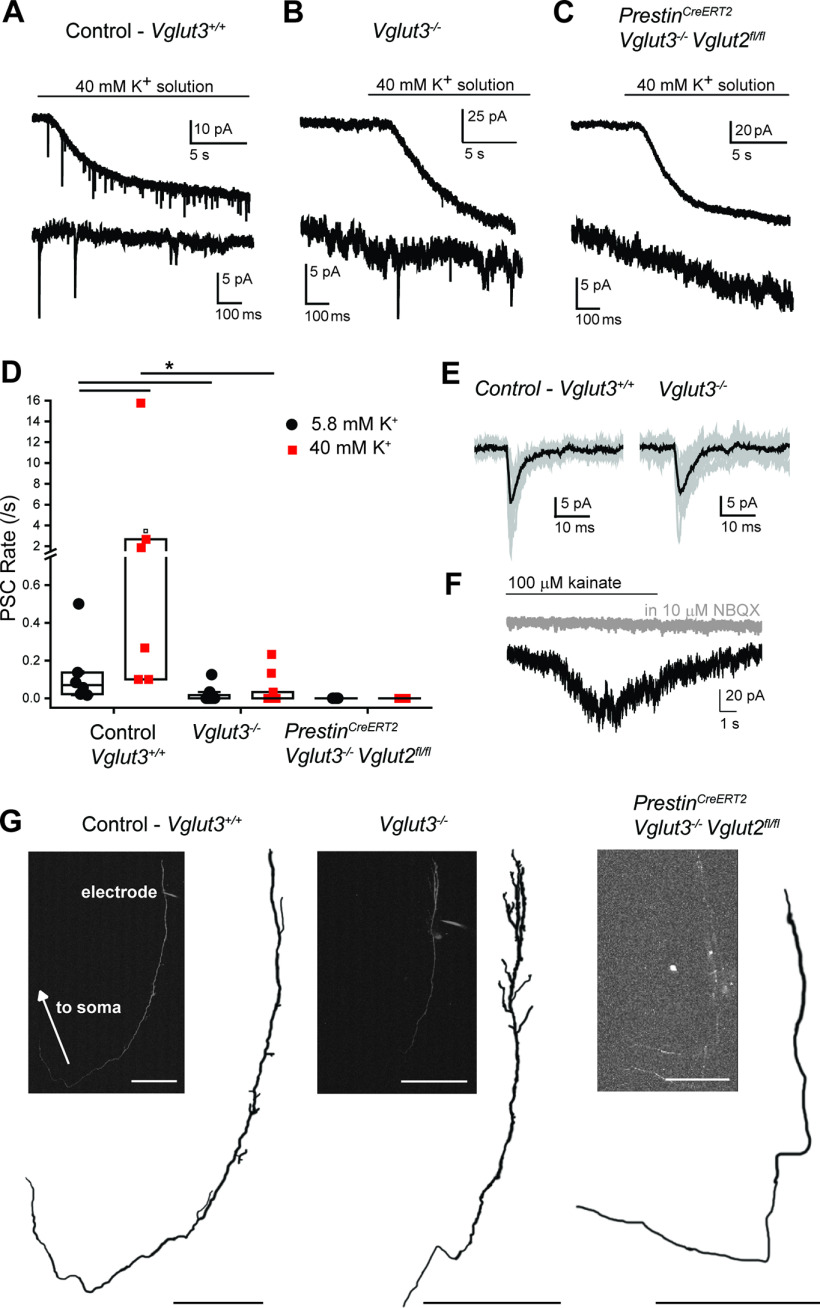
Figure 2.
VGluT2 and VGluT3 mediate glutamate release from cochlear OHCs. A, Voltage-clamp recording from a control (Vglut3fl/fl) Type II SG afferent dendrite. Top, Application of extracellular solution with elevated 40 mm potassium generates a sustained inward current, and PSCs in the Type II afferent. Bottom, Magnification of selected PSCs. B, Voltage-clamp recording from a Type II SG afferent dendrite of a Vglut3−/− mouse. Top, Application of 40 mm potassium solution generates an inward current and PSCs in the Type II SG afferent. Bottom, Magnification of selected PSCs. C, Voltage-clamp recording from a Type II SG afferent dendrite from a PrestinCreERT2;Vglut3−/−;Vglut2fl/fl mouse. Top, Application of 40 mm potassium solution generates an inward current in the dendrites but does not generate PSCs in the Type II SG afferent. Bottom, Magnification of trace. D, Scatter plot of PSC rate in normal (5.8 mm) and elevated (40 mm) potassium solution. Each dot represents one cell. Box represents median and quartiles. *p < 0.05. E, Example traces of PSCs recorded from a Vglut3+/+ WT (top) and Vglut3−/− mouse Bottom, Ten traces overlaid (gray). Black represents average of 10 traces. F, Voltage-clamp trace from a Type II SG dendrite from a PrestinCreERT2;Vglut3/;Vglut2fl/fl mouse. Focal application of 100 μM kainate evokes an inward current (black), which is blocked by 10 μM NBQX (gray). G, Morphology of example Type II SG neuron dendrites from which recordings were performed. Dendrites were filled with AlexaFluor-488 or -594 hydrazide via the recording pipette (visible, “electrode”) and imaged with 2-photon excitation. Traced neurons are shown for better visibility. Insets, Maximum intensity projections of each neuron (left, middle, right). Right inset, two dendrites are visible from separate recordings. Scale bars, 100 μm.

