
Figure 6.
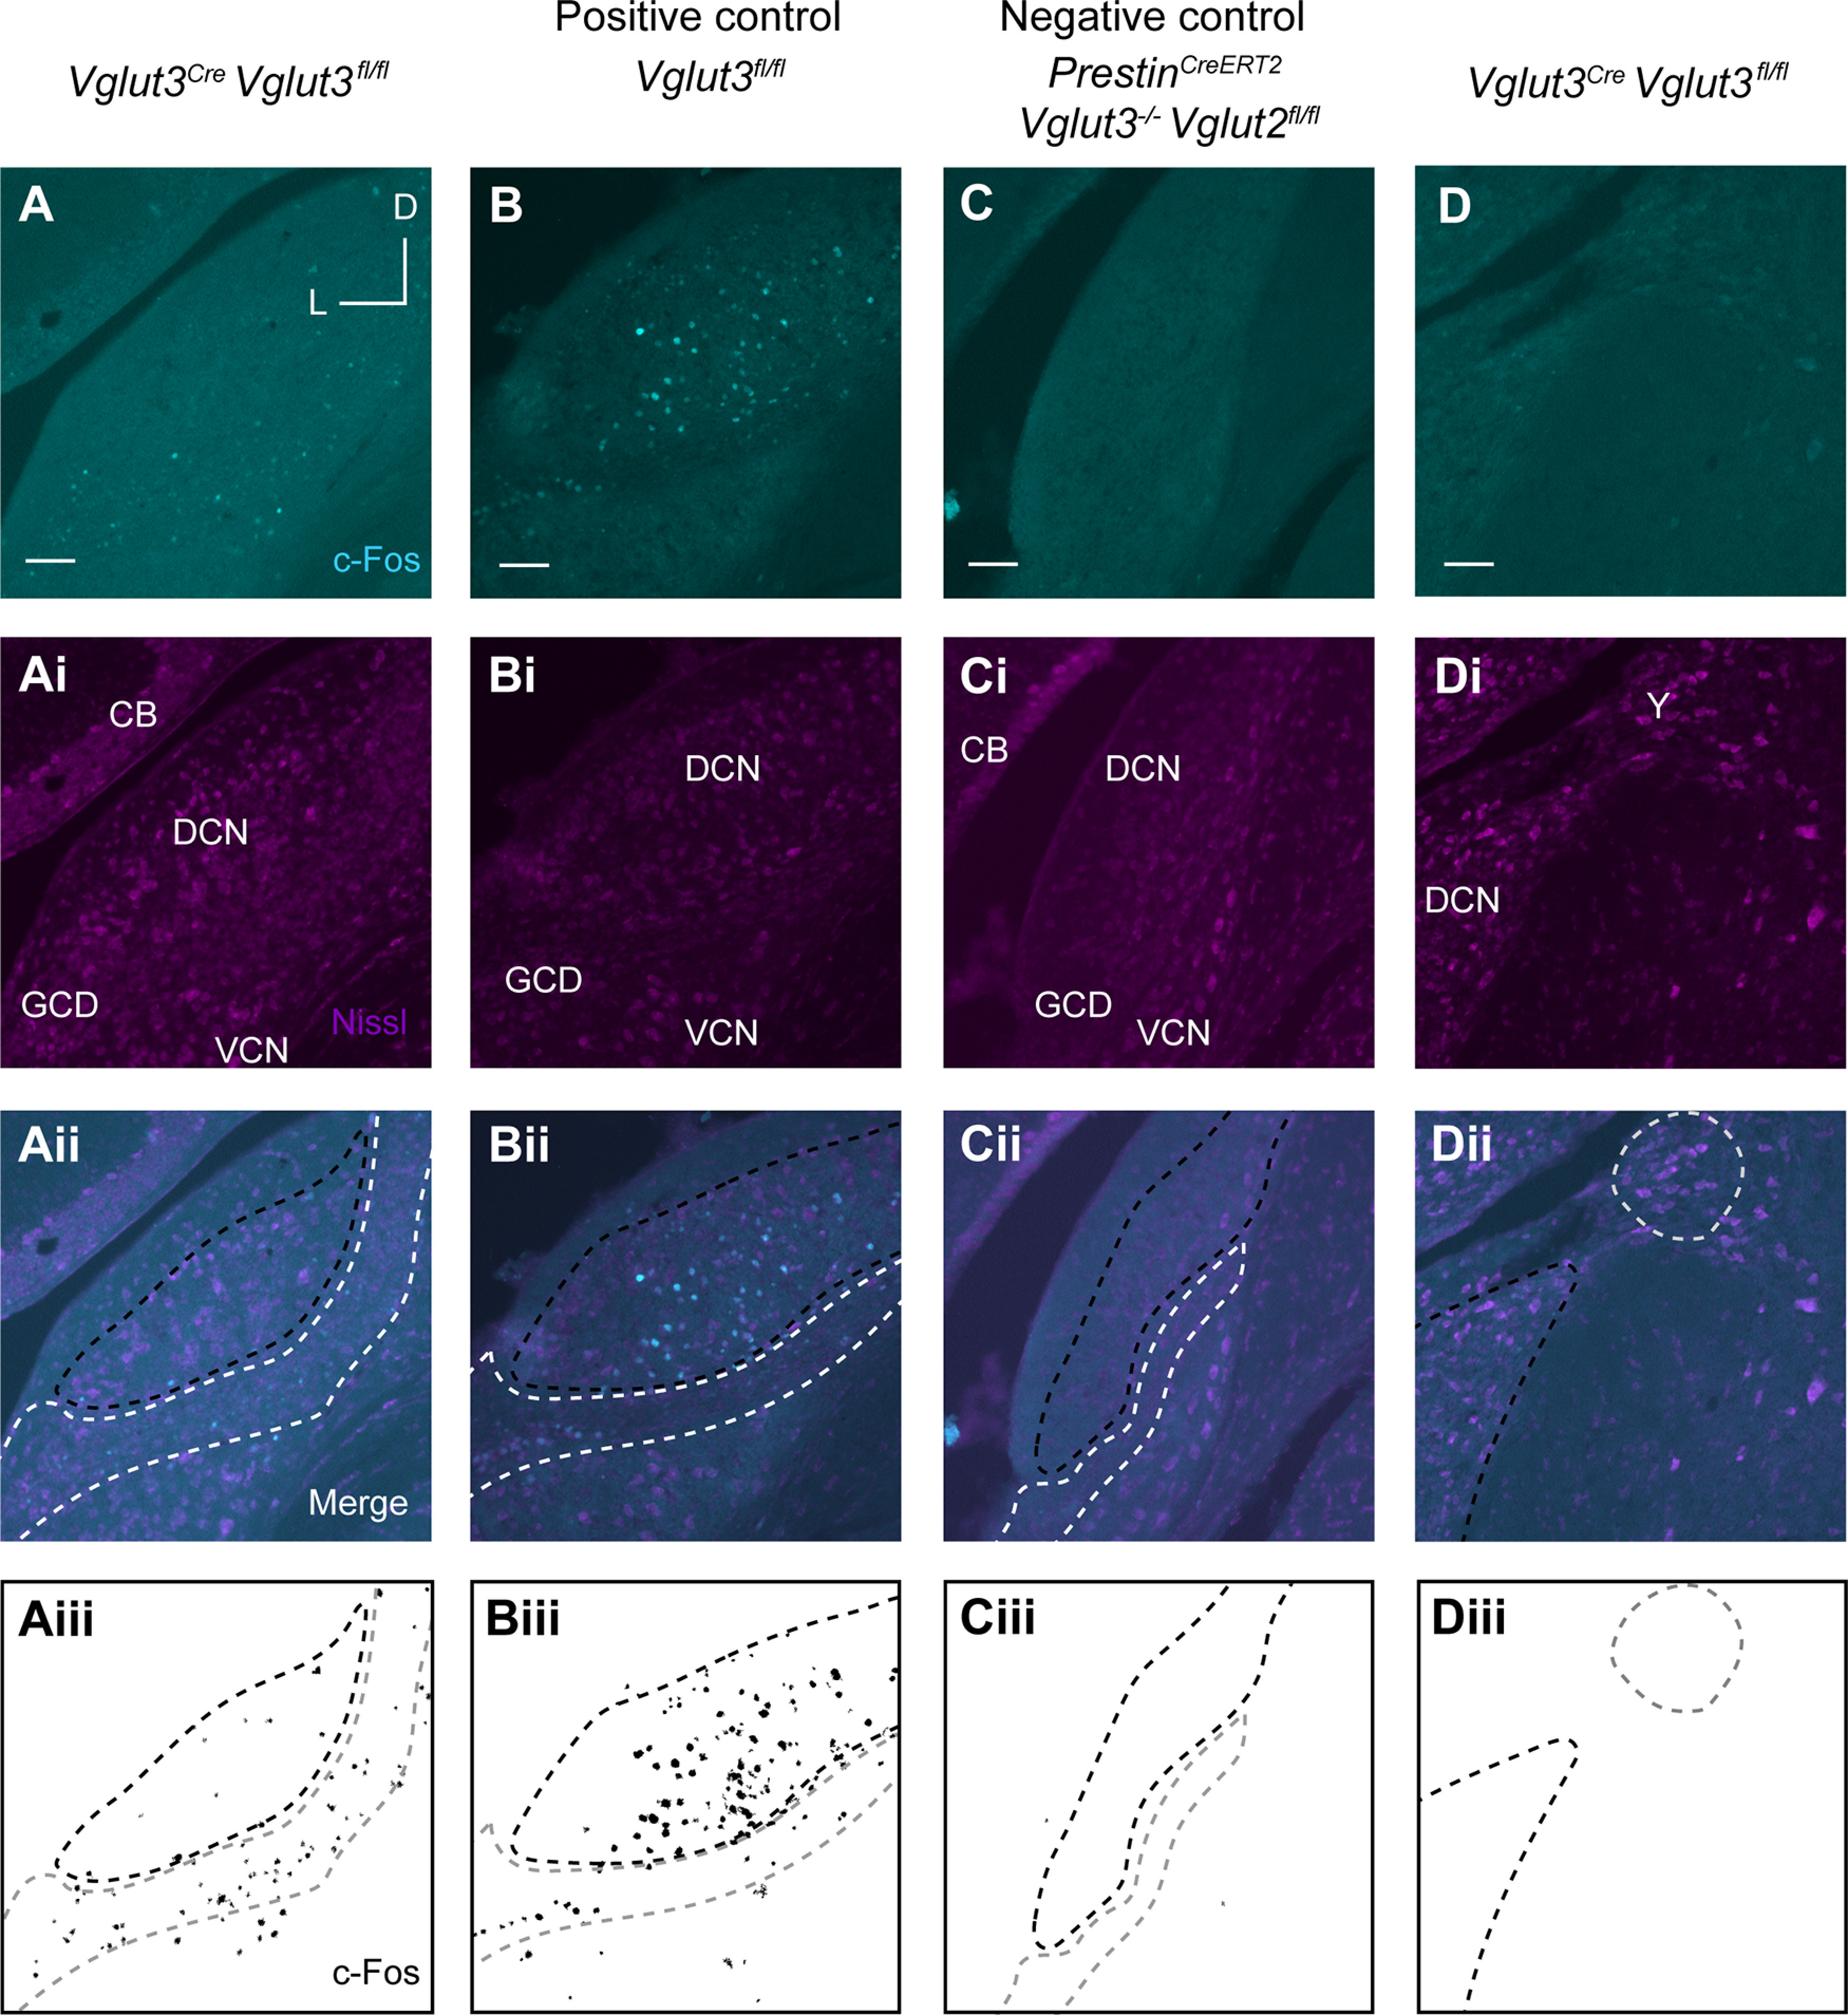
Sound-induced expression of c-Fos in the CN in response to an intense, 115 dB SPL, sound level. A, Representative image from Vglut3Cre;Vglut3fl/fl mouse after sound exposure shows c-Fos immunoreactivity (cyan) restricted to the GCD. Ai, Nissl staining (magenta). Aii, Merge of cyan and magenta channels. CB, Cerebellum. Aiii, Mask of c-Fos signal from A. Aii-Cii, Region enclosed by white dashed line indicates GCD. Region enclosed by black dashed line indicates regions of the DCN that also contain granule cells. Aiii-Ciii, Region enclosed by gray dashed line indicates GCD. Region enclosed by black dashed line indicates regions of the DCN that also contain granule cells. B, Representative image of CN from Vglut3fl/fl (positive control) after sound exposure shows c-Fos immunoreactivity (cyan) throughout DCN and GCD. Bi, Nissl staining of cell somata (magenta). Bii, Merge of cyan and magenta channels. Biii, Mask of c-Fos signal from B. C, Representative image from PrestinCreERT2;Vglut3−/−;Vglut2fl/fl negative control mouse indicates background levels of c-Fos immunoreactivity (cyan). Ci, Nissl staining (magenta). Cii, Merge of cyan and magenta channels. Ciii, Mask of c-Fos signal from C. D, Representative image from Vglut3Cre;Vglut3fl/fl after sound exposure shows a lack of c-Fos immunoreactivity (cyan) in Nucleus Y (Y). Di, Nissl staining (magenta). Y, Nucleus Y. Dii, Merge of cyan and magenta channels. Region enclosed by black dashed line indicates regions of the DCN. Region enclosed by gray dashed line indicates Nucleus Y. Diii, Mask of c-Fos signal from D. Region enclosed by black dashed line indicates regions of the DCN. Region enclosed by gray dashed line indicates Nucleus Y. Scale bar, 100 µm.