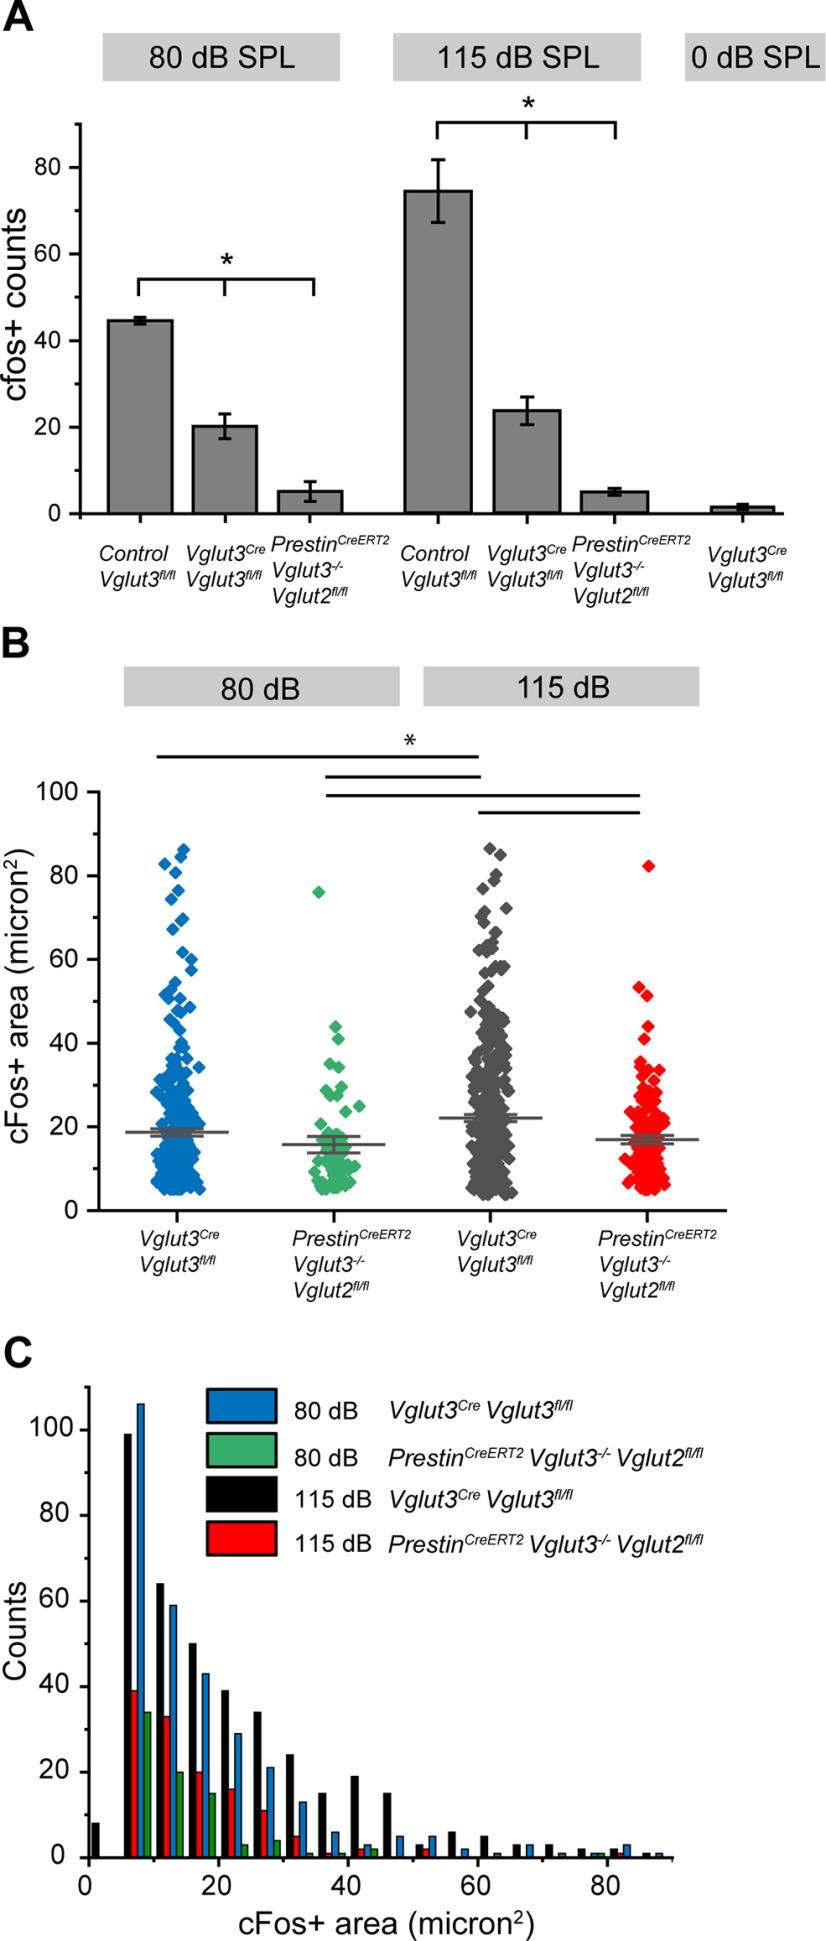
Figure 7.
Analysis of c-Fos+ neurons in the CN in response to sound. A, Quantification of the number of c-Fos+ neurons in CN of Vglut3fl/fl (positive control), Vglut3Cre;Vglut3fl/fl, and PrestinCreERT2;Vglut3−/−; Vglut2fl/fl (negative control) mice following 80, 115, or 0 dB SPL sound. *p < 0.05. B, Cell nuclei sizes of c-Fos+ neurons from Vglut3Cre;Vglut3fl/fl (blue) and PrestinCreERT2;Vglut3−/−;Vglut2fl/fl (green) mice exposed to 80 dB SPL sound, and from Vglut3Cre;Vglut3fl/fl (black) and PrestinCreERT2;Vglut3−/−;Vglut2fl/fl (red) mice exposed to 115 dB SPL sound. *p < 0.05. C, Frequency histogram of c-Fos+ cell nuclei sizes shown in B. n = 5-7 mice per genotype.

