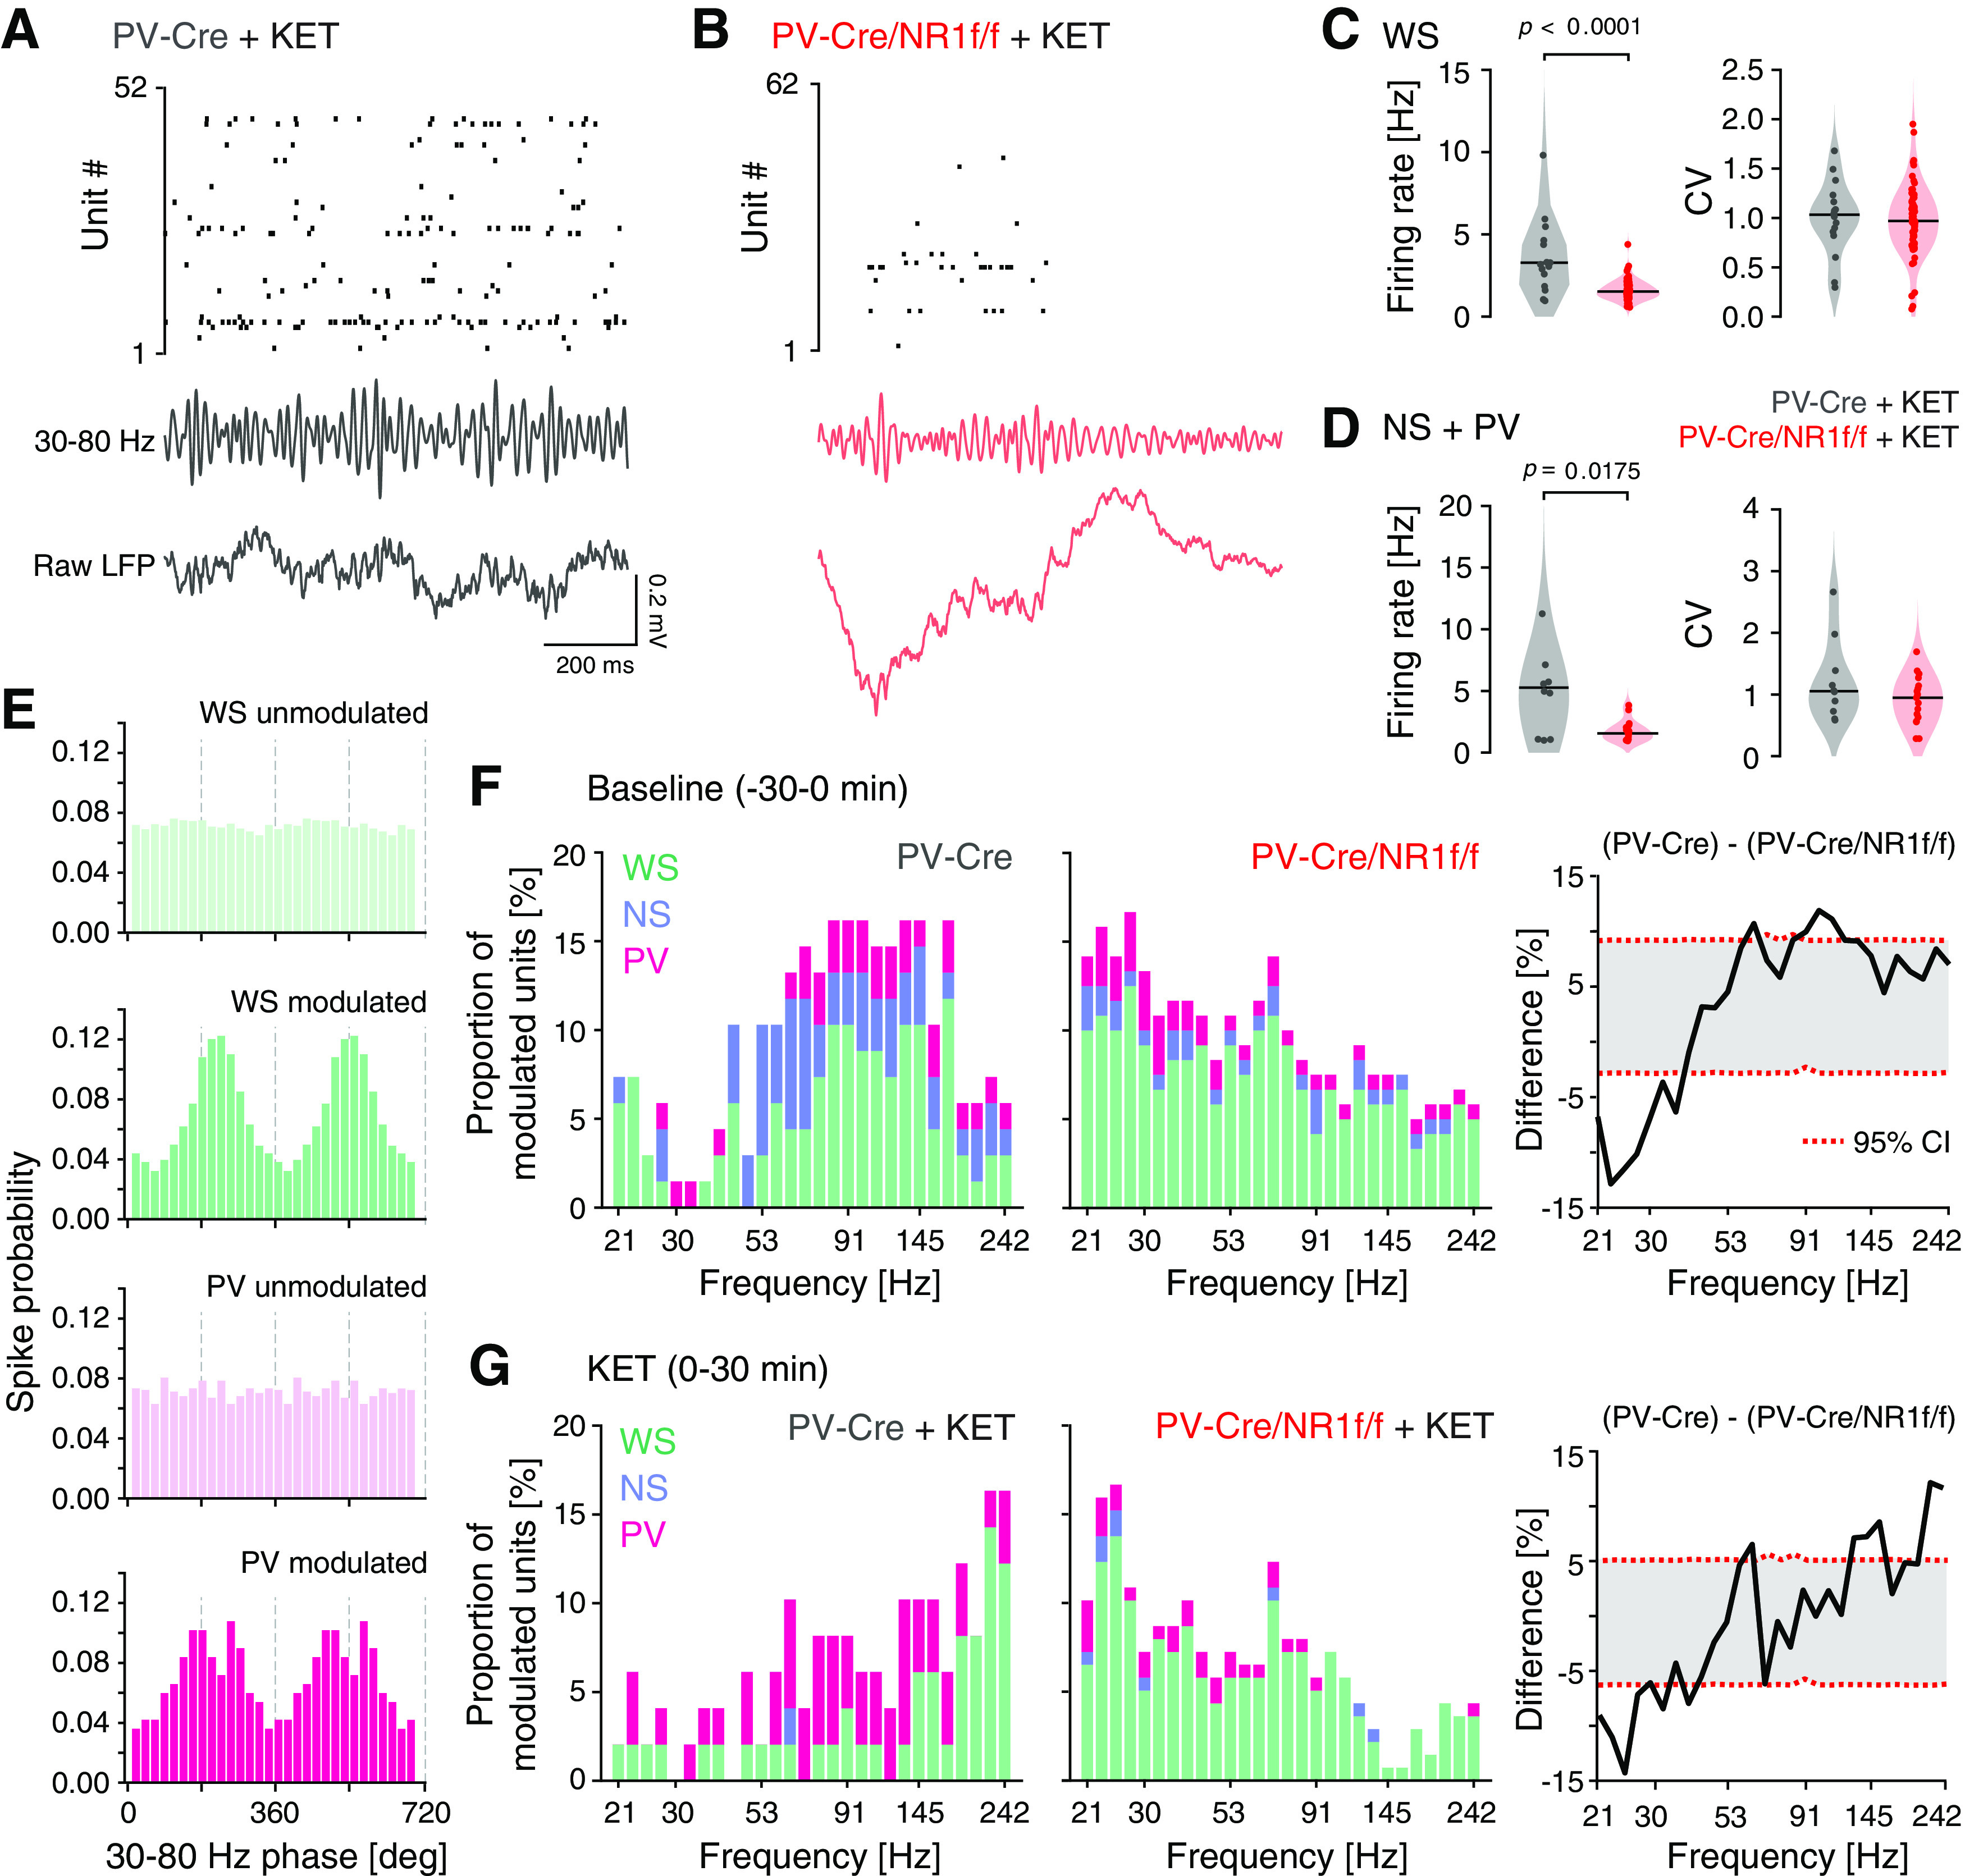
Figure 10.

Firing patterns and spike-LFP entrainment during baseline and after ketamine application. A, B, Representative (1 s) single-unit activity (top), filtered LFP in the 30-80 Hz band (middle), and raw LFP traces (bottom) for a PV-Cre (A) and a PV-Cre/NR1f/f mouse (B) after ketamine application. C, D, F, G, PV-Cre (n = 3; gray) and PV-Cre/NR1f/f mice (n = 3; red). C, FR properties of WS neurons (PV-Cre: n = 17 units; PV-Cre/NR1f/f: n = 69 units) after ketamine application (0-30 min). Left, The FR of WS neurons is significantly higher in PV-Cre mice than in PV-Cre/NR1f/f mice. Right, The CV of the ISI does not differ between PV-Cre and PV-Cre/NR1f/f mice. FR: PV-Cre: 3.28; PV-Cre/NR1f/f: 1.52; U = 189, p < 0.0001; CV: PV-Cre: 1.03; PV-Cre/NR1f/f: 0.97; U = 547, p = 0.6751. D, FR properties of NS+PV putative interneurons (PV-Cre: n = 10 units; PV-Cre/NR1f/f: n = 17 units) after ketamine application (0-30 min). Left, The FR of NS+PV interneurons is significantly higher in PV-Cre mice than in PV-Cre/NR1f/f mice after ketamine application. Right, The CV of the ISI does not differ between PV-Cre and PV-Cre/NR1f/f mice. FR: PV-Cre: 5.27; PV-Cre/NR1f/f: 1.56; U = 38, p = 0.0175; CV: PV-Cre: 1.05; PV-Cre/NR1f/f: 0.95; U = 64 p = 0.3093. E, Histograms of the spike modulation by broadband γ (30-80 Hz) phase. Four representative single neurons: light green represents nonmodulated WS; green represents modulated WS; light pink represents nonmodulated PV; pink represents modulated PV. F, G, Spike-LFP entrainment in PV-Cre (left) and PV-Cre/NR1f/f (middle) mice during baseline (−30 to 0 min) (F) and after ketamine application (0-30 min) (G). F, The proportion of neurons significantly (p < 0.01) modulated by different LFP frequencies (21-242 Hz; log scale). The spiking in PV-Cre mice is predominantly modulated by higher frequencies, and in PV-Cre/NR1f/f mice by lower frequencies. WS (green): PV-Cre: n = 22 units; PV-Cre/NR1f/f: n = 90 units; NS (blue): PV-Cre: n = 7 units; PV-Cre/NR1f/f: n = 12 units; PV (pink): PV-Cre: n = 3 units; PV-Cre/NR1f/f: n = 5 units. Right, Difference in the proportion of neurons (WS + NS + PV) significantly (p < 0.01) modulated by different LFP frequencies (21-242 Hz) between PV-Cre and PV-Cre/NR1f/f mice. The modulation of spiking by higher LFP frequencies is significantly stronger in PV-Cre than in PV-Cre/NR1f/f mice. G, Ketamine shifts the modulation of spiking in PV-Cre mice to higher LFP frequencies (>200 Hz) while the spiking in PV-Cre/NR1f/f mice at large is not affected. Right, After ketamine application, the modulation of frequencies >200 Hz is significantly stronger in PV-Cre than in PV-Cre/NR1f/f mice. C, D, Black line indicates median. Dots indicate individual neurons. F, G, Bars are stacked. Two-tailed unpaired t test was used to assess significance if data passed the D'Agostino & Pearson normality test; if not, the Mann–Whitney test was used. Complementary statistical information can be found in Extended Data Figure 10-1.
