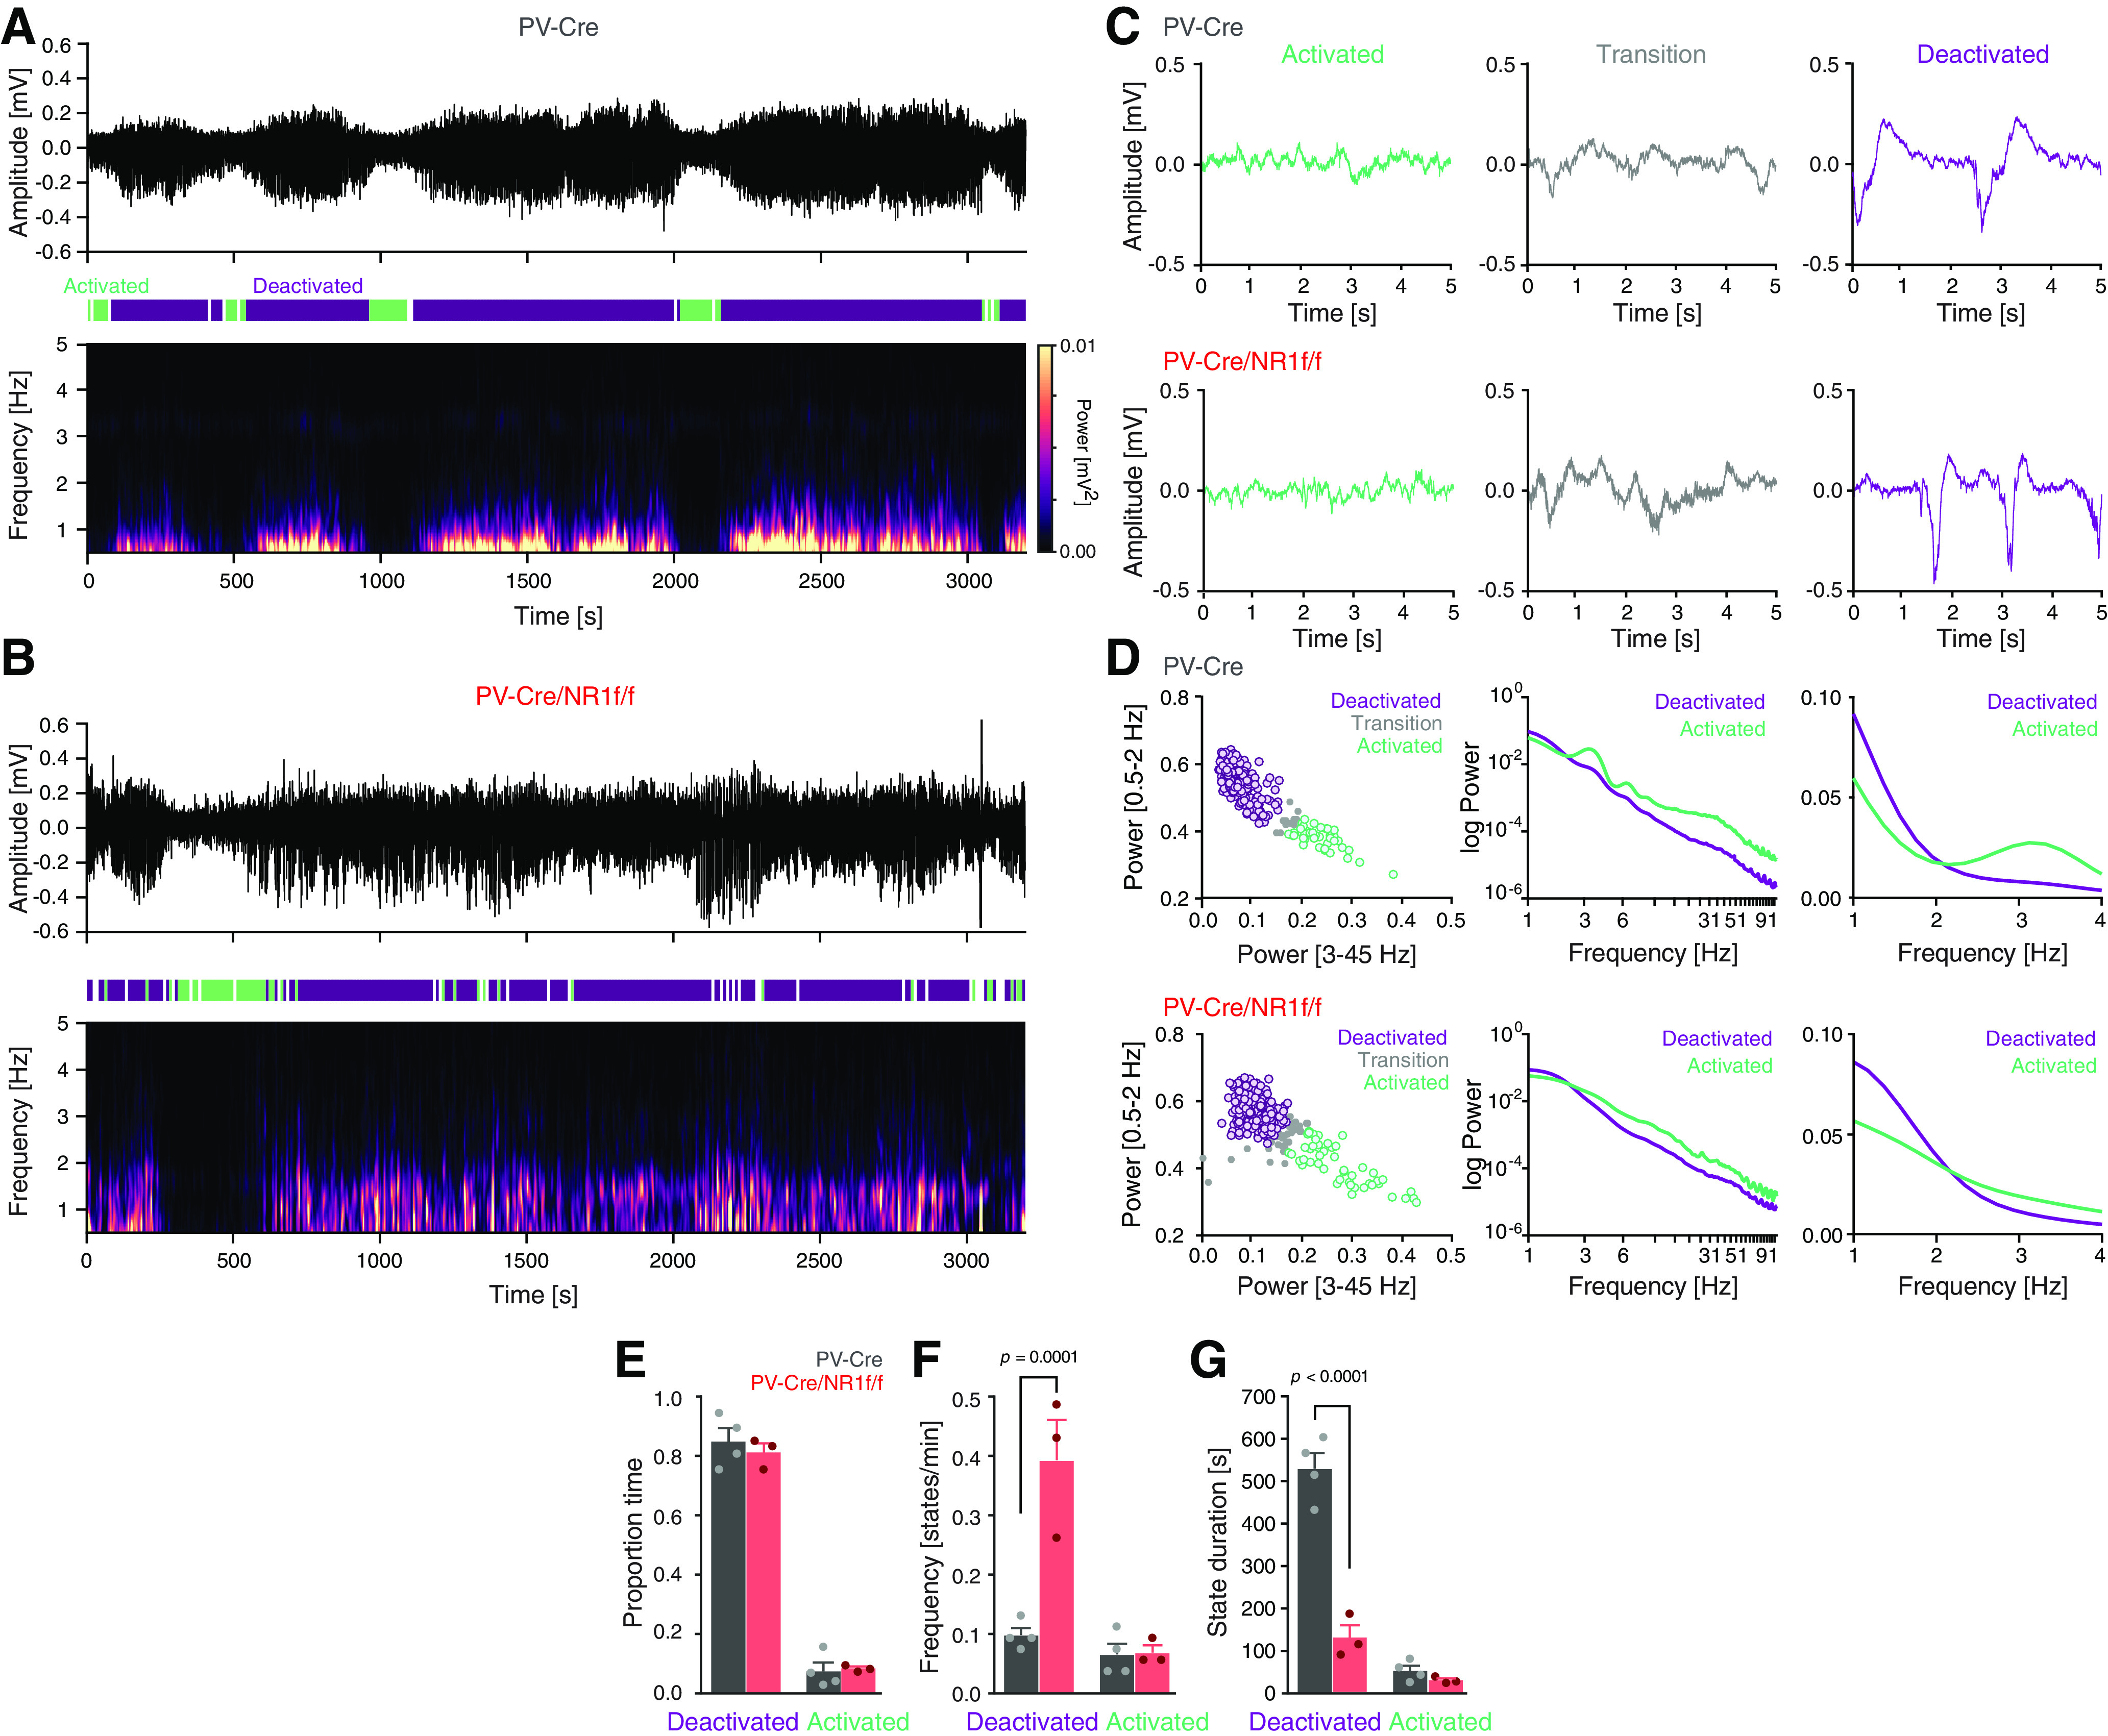
Figure 2.

Mice with lack of NMDAR activity in PV neurons display altered cortical states. A, B, Representative mPFC LFP oscillations (3200 s) recorded under urethane anesthesia in a PV-Cre (A) and a PV-Cre/NR1f/f (B) mouse, respectively. Top, Raw LFP. Middle, Color-coded outline of detected activated (green), deactivated (purple), and transition states (white). Bottom, Spectrogram (0-5 Hz) of the LFP trace in the top panel. A, Mice with intact NMDAR activity in PV neurons (PV-Cre) display typical cyclic transitions between deactivated (high-amplitude low-frequency [0.5-2 Hz] oscillations) and activated states (low-amplitude higher-frequency oscillations). B, PV-Cre/NR1f/f mice show less defined slow oscillations along with altered transition patterns between deactivated and activated states. C, Representative LFP traces (5 s) of activated (green), transition (gray), and deactivated states (purple), respectively, from a PV-Cre mouse (top) and a PV-Cre/NR1f/f mouse (bottom). D-G, PV-Cre mice (n = 4, gray) and PV-Cre/NR1f/f mice (n = 3, red). D, Classification of brain states in PV-Cre mice (top) and PV-Cre/NR1f/f mice (bottom). Left, For detection of deactivated, activated, and transition (unclassified) states, a GMM was used for clustering of 30 s epochs (colored circles) of the LFP trace based on the power in the 0.5-2 Hz and 3-45 Hz frequency bands. Middle, Relative PSD (1-91 Hz) of the LFP for the activated (green) and deactivated (purple) states. Right, Magnification of the relative PSD of the LFP in the 1-4 Hz frequency band. E-G, Comparisons of the proportion (of total time), frequency (states/min), and duration, of deactivated and activated states in PV-Cre mice and PV-Cre/NR1f/f mice. E, There is no difference in the proportion time spent in deactivated and in activated states between PV-Cre/NR1f/f and PV-Cre mice (F(1,10) = 0.1908, p = 0.6715). Deactivated: PV-Cre: 0.85 ± 0.04; PV-Cre/NR1f/f: 0.81 ± 0.03; p = 0.8768; activated: PV-Cre: 0.07 ± 0.03; PV-Cre/NR1f/f: 0.08 ± 0.01; p > 0.9999. F, Mice lacking NMDAR in PV neurons (PV-Cre/NR1f/f) transition into deactivated states significantly more often than mice with intact NMDAR in PV neurons (PV-Cre mice) (F(1,10) = 0.2252, p = 0.0008). Frequency (states/min) of deactivated: PV-Cre: 0.098 ± 0.012 states/min; PV-Cre/NR1f/f: 0.394 ± 0.068 states/min; p = 0.0001; activated: PV-Cre: 0.066 ± 0.018 states/min; PV-Cre/NR1f/f: 0.069 ± 0.013 states/min; p > 0.9999. G, The duration of the deactivated states is significantly shorter in mice lacking NMDAR in PV neurons (PV-Cre/NR1f/f) than in mice with intact NMDAR in PV neurons (PV-Cre) (F(1,10) = 64.89, p < 0.0001). Deactivated: PV-Cre: 530.46 ± 37.31 s; PV-Cre/NR1f/f: 130.63 ± 29.09 s; p < 0.0001; activated: PV-Cre: 51.88 ± 11.79 s; PV-Cre/NR1f/f: 29.33 ± 4.44 s; p > 0.9999. Data are mean ± SEM. E–G, Two-way ANOVA was used to assess significance, followed by a Bonferroni's multiple comparisons test if the ANOVA comparisons reached significance.
