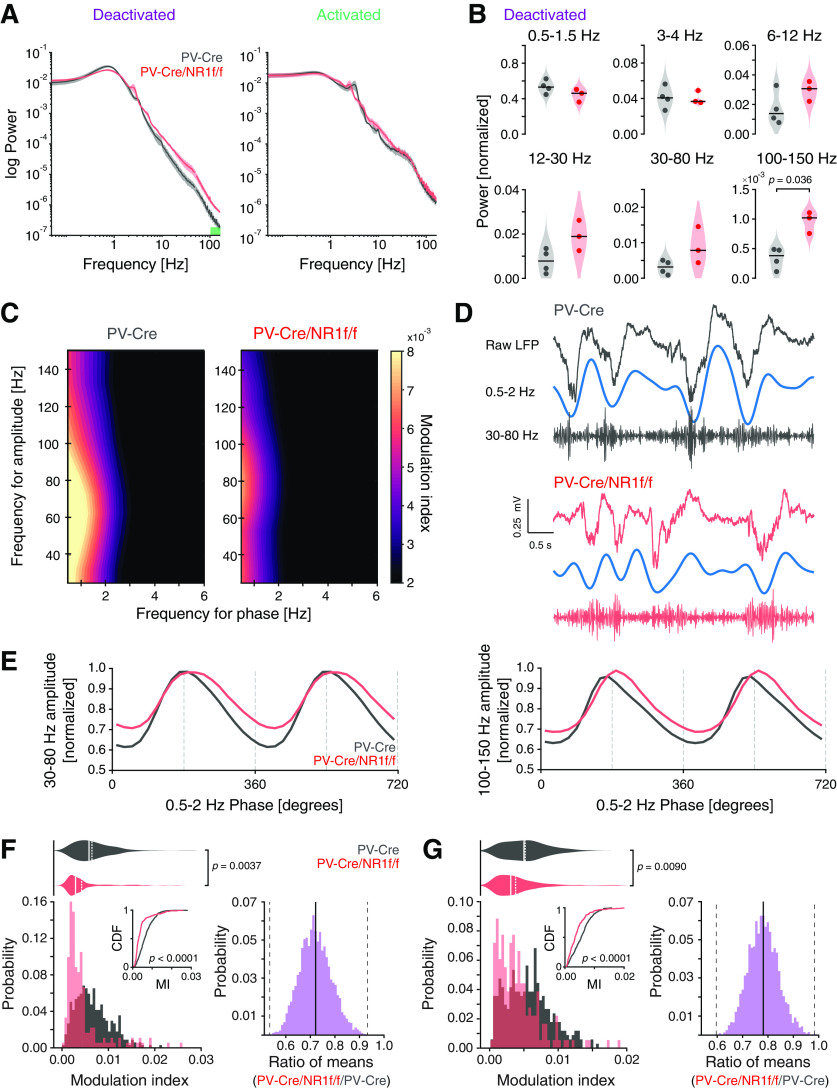
Figure 3.
Mice with lack of NMDAR activity in PV neurons display increased broadband γ power and decreased δ-phase modulation of broadband γ and HFB amplitude. A, B, E-G, PV-Cre mice (n = 4, gray) and PV-Cre/NR1f/f mice (n = 3, red). A, Mean PSD of the LFP of deactivated (left) and activated (right) states. Green bar represents frequency band (100-150 Hz) with significant power difference between PV-Cre and PV-Cre/NR1f/f mice. B, Comparisons of the integrated power at different frequency bands during deactivated states between PV-Cre and PV-Cre/NR1f/f mice. Low-δ (0.5-1.5 Hz): PV-Cre: 0.53 ± 0.04; PV-Cre/NR1f/f: 0.44 ± 0.01; t = 1.62, p = 0.99; high-δ (3-4 Hz): PV-Cre: 0.041 ± 0.006; PV-Cre/NR1f/f: 0.040 ± 0.004; t = 0.09, p = 1; theta (6-12 Hz): PV-Cre: 0.017 ± 0.006; PV-Cre/NR1f/f: 0.029 ± 0.004; t = −1.67, p = 0.93; β (12-30 Hz): PV-Cre: 0.008 ± 0.003; PV-Cre/NR1f/f: 0.019 ± 0.004; t = −2.48, p = 0.34; broadband γ (30-80 Hz): PV-Cre: 0.003 ± 0.001; PV-Cre/NR1f/f: 0.009 ± 0.003; t = −2.12, p = 0.52; HFB (100-150 Hz): PV-Cre: 0.00034 ± 0.0001; PV-Cre/NR1f/f: 0.00102 ± 0.0001; t = −4.55, p = 0.036. C, Representative phase-amplitude comodulograms of a PV-Cre (left) and a PV-Cre/NR1f/f mouse (right), respectively, showing the modulation of the broadband γ and the HFB amplitude by the phase of 0.5-2 Hz oscillations. D, Representative unfiltered LFP trace (top) and filtered 0.5-2 Hz (middle) and broadband γ (30-80 Hz; bottom) bands during a deactivated state in a PV-Cre and a PV-Cre/NR1f/f mouse, respectively. E, Mean broadband γ amplitude (left) and mean HFB amplitude (right) at different phases of the 0.5-2 Hz cycles. F, Left, Comparison of the probability distribution of the MI between broadband γ amplitude and 0.5-2 Hz phase shows that PV-Cre/NR1f/f mice have more deactivated epochs (30 s) with lower MI (p < 0.0001, CDF inset) and significantly decreased comodulation between broadband γ amplitude and 0.5-2 Hz phase compared with PV-Cre mice (PV-Cre: 0.0072 ± 0.0012; PV-Cre/NR1f/f: 0.0052 ± 0.0021; F(1,7) = 18.180, p = 0.0037, LMM; right, CI from bootstrap analysis: [0.50, 0.92]). G, Left, Comparison of the probability distribution of the MI between HFB amplitude and 0.5-2 Hz phase shows that PV-Cre/NR1f/f mice have significantly more deactivated epochs (30 s) with lower MI (p < 0.0001, CDF inset) and significantly decreased comodulation between HFB amplitude and 0.5-2 Hz phase compared with PV-Cre mice (PV-Cre: 0.0059 ± 0.0014; PV-Cre/NR1f/f: 0.0046 ± 0.0013; F(1,7) = 12.826, p = 0.0090, LMM; right, CI from bootstrap analysis: [0.59, 0.96]). Data are mean ± SEM. A, Lines indicate mean. Shaded areas represent SEM. B (violin plots), Black line indicates median. Dot indicates mice. F, G (violin plots), Solid line indicates mean. Dashed line indicates median. F, G (bootstrap plots), Solid line indicates mean. Dashed line indicates 95% CI. B, Two-tailed unpaired t test was used to assess significance after data passed the Shapiro–Wilk normality test, and Bonferroni adjustment was applied to correct for multiple comparisons. F, G, The Kolmogorov–Smirnov test was used to assess significance between CDFs, and complemented with an LMM and a bootstrap analysis to assess significance between PV-Cre and PV-Cre/NR1f/f mice while accounting for intragroup variability. Complementary statistical information can be found in Extended Data Figure 3-1.

