Figure 8.
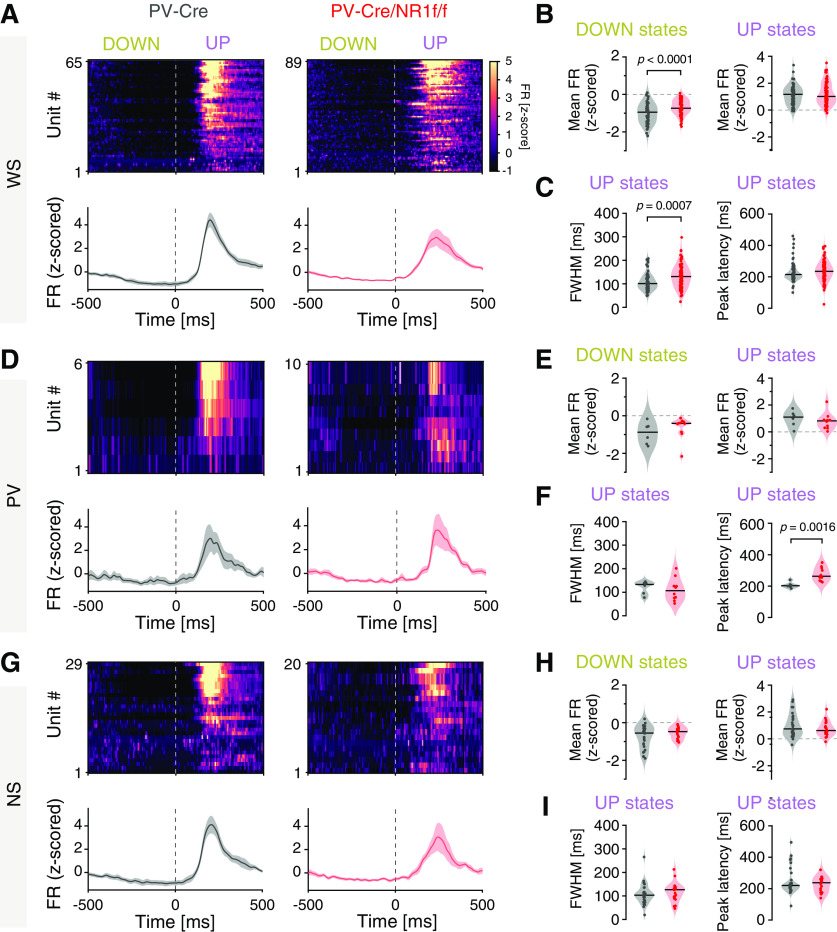
Mice with lack of NMDAR activity in PV neurons display altered temporal dynamics of single-unit activity during DOWN-to-UP state transitions. A–I, PV-Cre (n = 4; gray) and PV-Cre/NR1f/f mice (n = 3; red). A, Firing rate (FR) dynamics of WS neurons during DOWN-to-UP state transition (−500 to 500 ms, 0 ms = transition [dashed line]). PV-Cre (gray; n = 65 units) and PV-Cre/NR1f/f mice (red; n = 89 units). Top, PETH showing mean FR (z-scored) of single WS units. Units are sorted according to their mean FR (z-scored) during the UP state (0-500 ms). Bottom, Mean FR (z-scored) for all WS units. B, C, Firing properties of WS neurons during DOWN-to-UP state transition (−500 to 500 ms). B, The WS FR (z-scored) is significantly higher in PV-Cre/NR1f/f mice than in PV-Cre mice during DOWN states. DOWN: PV-Cre: −0.95; PV-Cre/NR1f/f: −0.74; t = 4.575, p <0.0001; UP: PV-Cre: 1.17; PV-Cre/NR1f/f: 1.01; t = 0.7078, p = 0.4802. C, Left, FWHM of the mean firing curve of individual WS neurons showing significantly increased spike time variability of WS in PV-Cre/NR1f/f mice compared with in PV-Cre mice. Right, Peak latency of the spiking of individual WS neurons. FWHM: PV-Cre: 100.9 ms; PV-Cre/NR1f/f: 130.9 ms; U = 1972, p = 0.0007; peak latency: PV-Cre: 215 ms; PV-Cre/NR1f/f: 235 ms; U = 2391, p = 0.0661. D-F, Same as in A–C, but for PV interneurons. PV-Cre (gray; n = 6 units) and PV-Cre/NR1f/f mice (red; n = 10 units). E, The PV FR (z-scored) during DOWN (left) and UP states (right). DOWN: PV-Cre: −0.87; PV-Cre/NR1f/f: −0.41; U = 18, p = 0.2198; UP: PV-Cre: 1.10; PV-Cre/NR1f/f: 0.81; U = 20, p = 0.3132. F, Left, FWHM of the mean firing curve of individual PV interneurons. Right, The peak latency of the spiking of individual PV interneurons is significantly increased in PV-Cre/NR1f/f mice compared with that in PV-Cre mice. FWHM: PV-Cre: 133.2 ms; PV-Cre/NR1f/f: 106.3 ms; U = 20, p = 0.3132; peak latency: PV-Cre: 202.5 ms; PV-Cre/NR1f/f: 262.5 ms; U = 3, p = 0.0016. G-I, Same as in A–C, but for NS putative interneurons. PV-Cre (gray; n = 29 units) and PV-Cre/NR1f/f mice (red; n = 20 units). H, The NS FR (z-scored) during DOWN (left) and UP states (right). DOWN: PV-Cre: −0.55; PV-Cre/NR1f/f: −0.48; t = 1.452, p = 0.1532; UP: PV-Cre: 0.74; PV-Cre/NR1f/f: 0.61; t = 1.06, p = 0.2944. I, Left, FWHM of the mean firing curve of individual NS interneurons. Right, Peak latency of the spiking of individual NS interneurons. FWHM: PV-Cre: 102.8 ms; PV-Cre/NR1f/f: 126.5 ms; U = 244, p = 0.3581; peak latency: PV-Cre: 220 ms; PV-Cre/NR1f/f: 237 ms; U = 271, p = 0.7052. A, D, G, Data are mean ± SEM (shaded area). Violin plots: Black line indicates median. Dots indicate individual neurons. Two-tailed unpaired t test was used to assess significance if data passed the D'Agostino & Pearson normality test; if not, the Mann–Whitney test was used. Descriptive statistics for individual mice can be found in Extended Data Figure 8-1.

