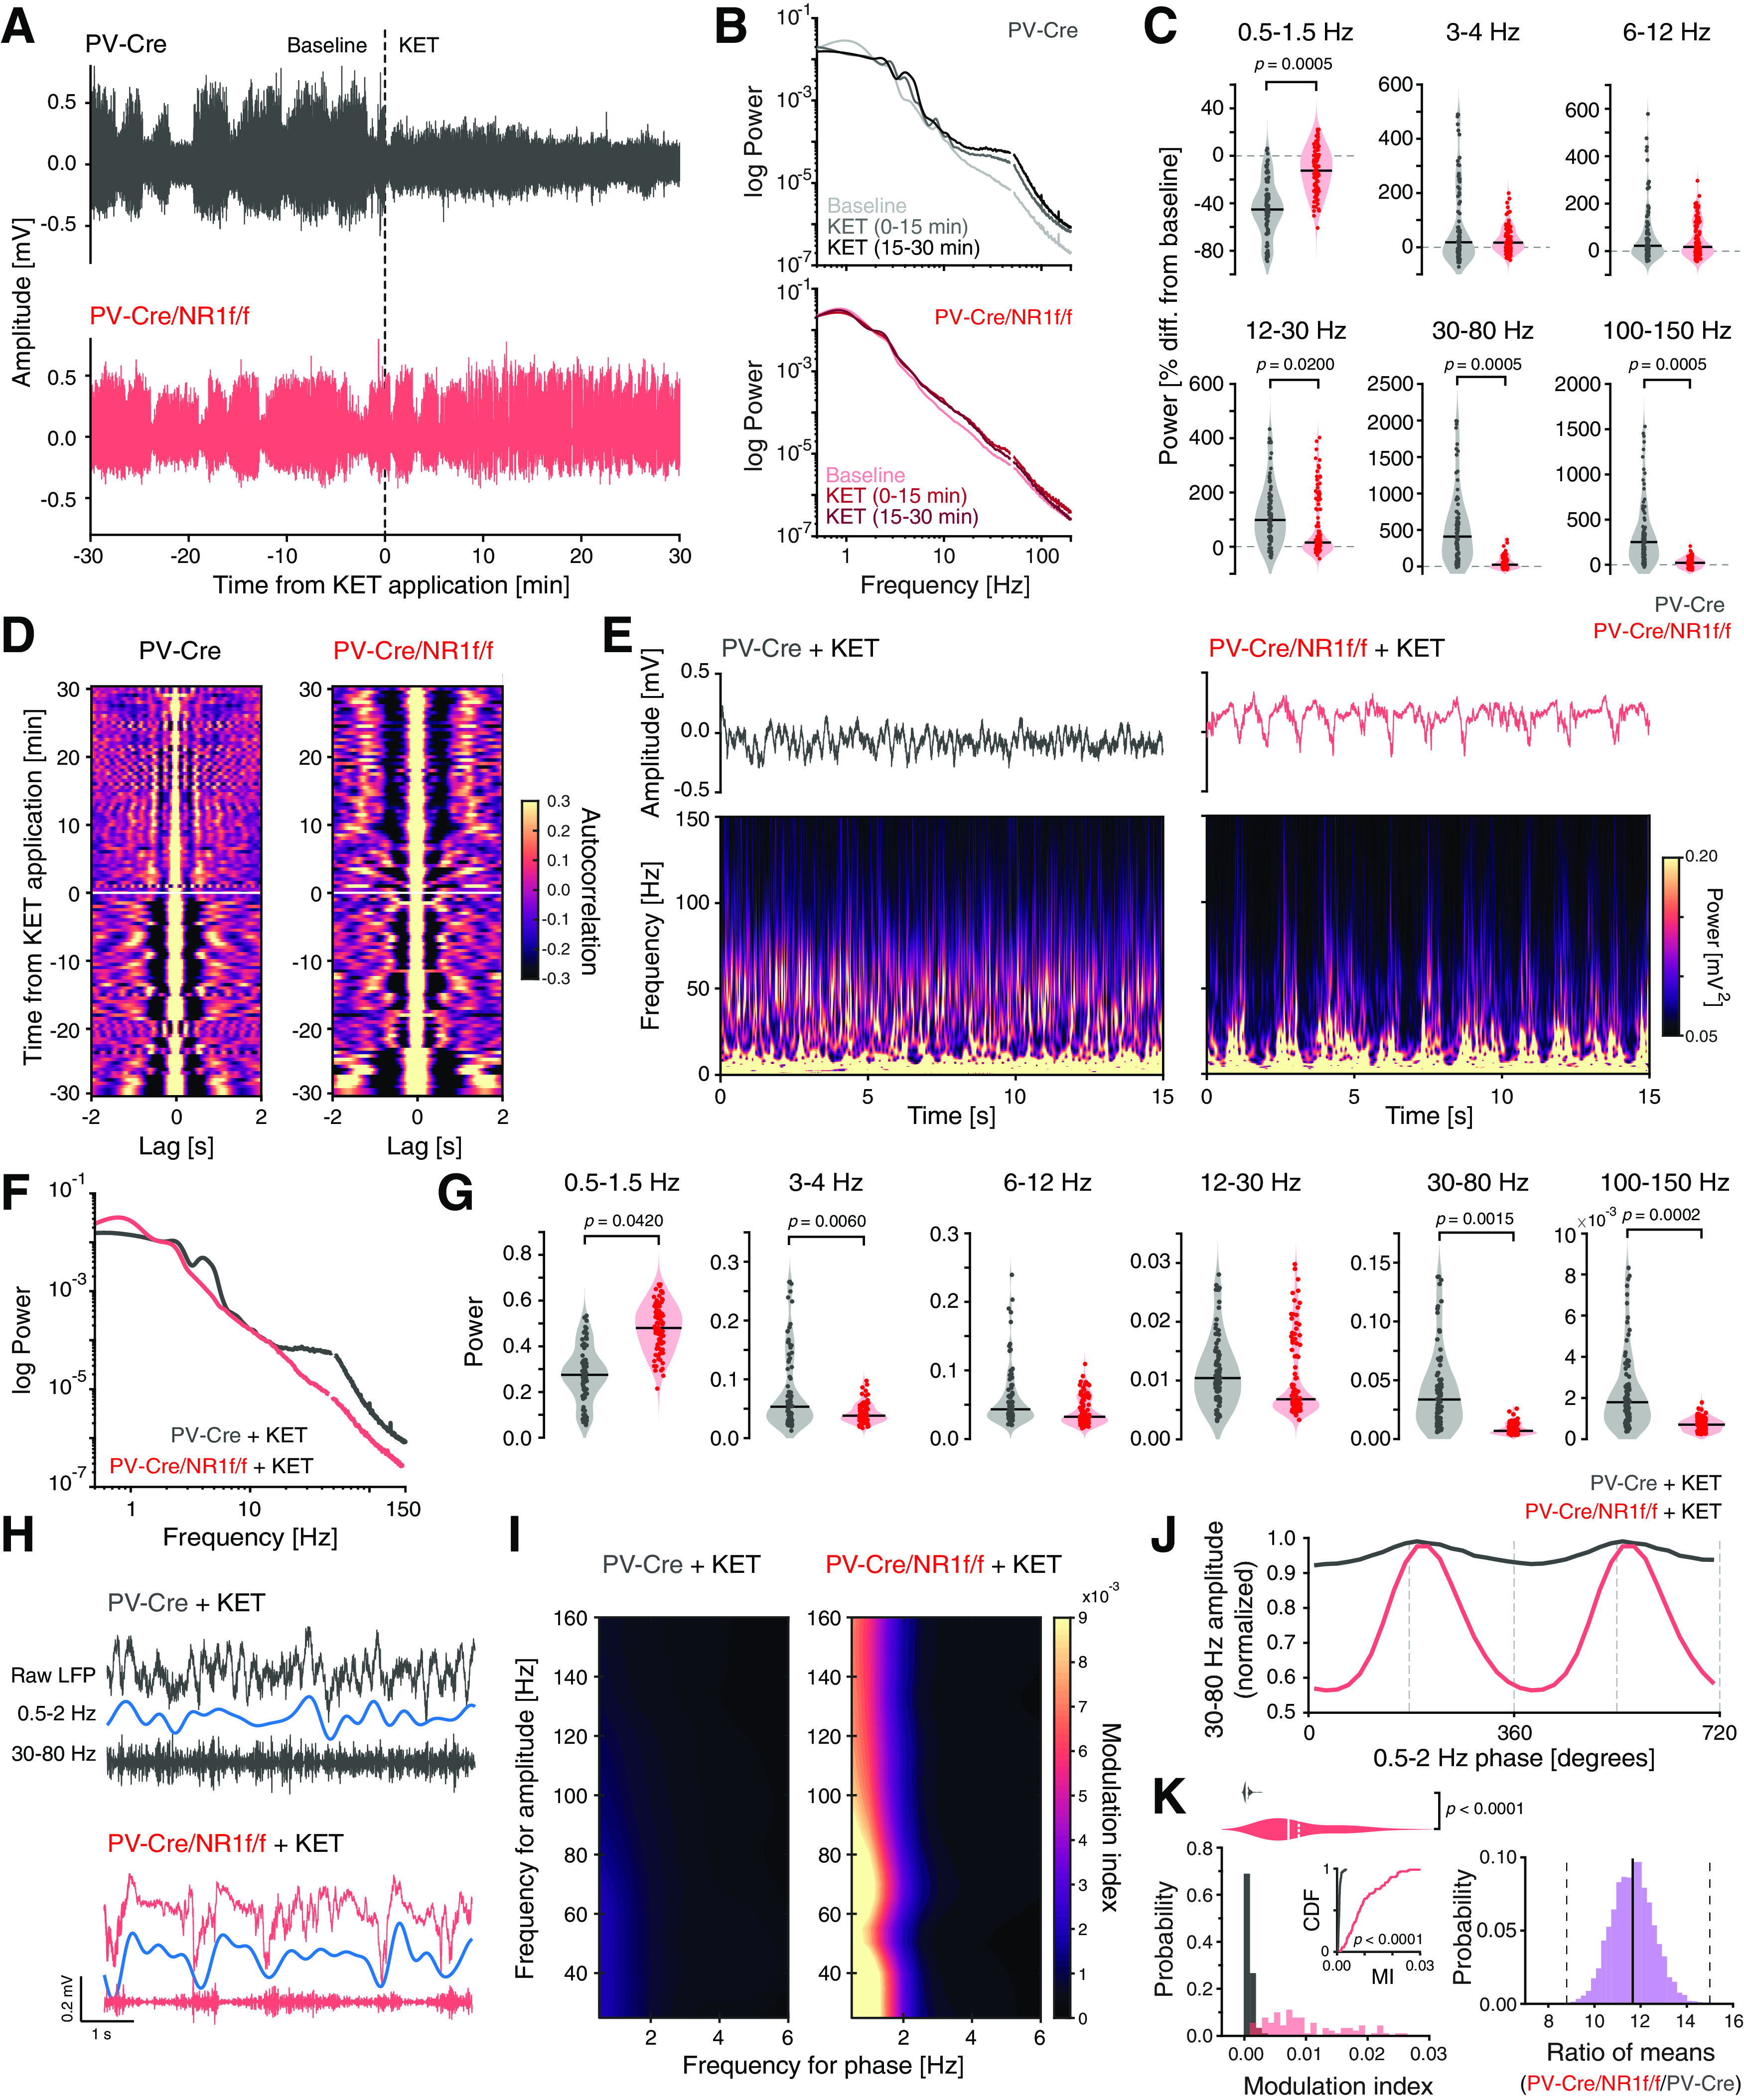
Figure 9.

Distinct spectral characteristics of the LFP induced by ketamine. A, Representative unfiltered mPFC LFP traces (60 min) from a PV-Cre (top) and a PV-Cre/NR1f/f (bottom) mouse recorded under urethane anesthesia. Ketamine (KET) was locally applied at t = 0 (dashed line). In PV-Cre mice, ketamine application switched the LFP oscillations from predominantly low frequencies of high amplitude to higher frequencies of low amplitude. In contrast, ketamine application did not cause any major changes in the mPFC LFP oscillations in PV-Cre/NR1f/f mice. B, C, F, G, J, K, PV-Cre (n = 3; gray) and PV-Cre/NR1f/f mice (n = 3; red). B, Mean PSD of the LFP during baseline (−30 to 0 min), 0-15 min, and 15-30 min after ketamine application. C, Ketamine induced power change (from baseline) in different frequency bands (−30 to 0 vs 0-30 min). Ketamine application decreased the power in the low-δ band (0.5-1.5 Hz) and increased the power in the β (12-30 Hz), broadband γ (30-80 Hz), and HFB (100-150 Hz) to a significantly larger extent in PV-Cre than PV-Cre/NR1f/f mice. Low-δ: PV-Cre: −45.22%; PV-Cre/NR1f/f: −12.49%; U = 1185, p = 0.0005; high-δ: PV-Cre: 18.40%; PV-Cre/NR1f/f: 17.10%; U = 3980 p = 1; theta: PV-Cre: 22.5%; PV-Cre/NR1f/f: 17.20%; U = 4001, p = 1; β: PV-Cre: 98.3%; PV-Cre/NR1f/f: 15%; U = 3030, p = 0.0200; broadband γ: PV-Cre: 408.2%; PV-Cre/NR1f/f: 24%; U = 827, p = 0.0005; HFB: PV-Cre: 251.4%; PV-Cre/NR1f/f: 21.2%; U = 1054, p = 0.0005. D, Evolution of the autocorrelograms of the LFP traces in A through time (60 min), before (−30 to 0 min), and after (0-30 min) ketamine application (t = 0; white line). Color bar represents the LFP autocorrelation coefficients. Ketamine lowers the LFP autocorrelation in PV-Cre mice, indicating desynchronized LFP oscillations, while the LFP in PV-Cre/NR1f/f mice at large does not change. E-G, Direct comparison of LFP activities after ketamine application between PV-Cre mice and PV-Cre/NR1f/f mice. E, Top, 15 s of the unfiltered LFP traces in A after ketamine application. Bottom, Spectrograms (0-150 Hz) of the LFP traces, color bar represents LFP power. Ketamine application triggered a state with persistent high-frequency (>30 Hz) activity of low amplitude in the LFP oscillations in PV-Cre mice, while the low-frequency activity of high amplitude remained in PV-Cre/NR1f/f mice after ketamine application (see also D). F, Mean PSD (0-150 Hz) of the LFP after ketamine application (0-30 min), demonstrating decreased power in lower frequencies and increased power in higher frequencies in PV-Cre, but not PV-Cre/NR1f/f mice. G, Power of the different frequency bands after ketamine application (0-30 min). PV-Cre mice display significantly higher power in most frequency bands compared with PV-Cre/NR1f/f mice but significantly lower power in the low-δ (0.5-1.5 Hz) band. Low-δ: PV-Cre: 0.27 ± 0.06; PV-Cre/NR1f/f: 0.48 ± 0.03; F(1,6) = 15.540, p = 0.0462; high-δ: PV-Cre: 0.053 ± 0.032; PV-Cre/NR1f/f: 0.038 ± 0.004; Wald χ2 = 6.43, p = 0.0673; theta: PV-Cre: 0.043 ± 0.019; PV-Cre/NR1f/f: 0.032 ± 0.011; Wald χ2 = 6.43, p = 1; β: PV-Cre: 0.0104 ± 0.0027; PV-Cre/NR1f/f: 0.0068 ± 0.0040; F(1,6) = 0.182, p = 1; broadband γ: PV-Cre: 0.0336 ± 0.0194; PV-Cre/NR1f/f: 0.0068 ± 0.0011; Wald χ2 = 13.354, p = 0.0015; HFB: PV-Cre: 0.0018 ± 0.0001; PV-Cre/NR1f/f: 0.0007 ± 0.0003; Wald χ2 = 17.359, p = 0.0002. H-K, Phase amplitude comodulation after ketamine application (0-30 min). H, Representative unfiltered LFP traces (top), filtered 0.5-2 Hz (middle), and broadband γ (30-80 Hz; bottom). I, Representative phase-amplitude comodulograms of a PV-Cre (left) and a PV-Cre/NR1f/f mouse (right) after ketamine application (0-30 min). Ketamine decreases the modulation of broadband γ amplitude by the 0.5-2 Hz phase in PV-Cre, but not in PV-Cre/NR1f/f mice. Color bar represents the MI. J, Mean broadband γ (30-80 Hz) amplitude at different phases of the 0.5-2 Hz cycles after ketamine application (0-30 min). K, Left, Comparison of the probability distribution of the MI between broadband γ (30-80 Hz) amplitude and the 0.5-2 Hz phase after ketamine application (0-30 min) shows that most epochs (30 s) in PV-Cre mice have minimal MI (p < 0.0001, CDF inset) and the PV-Cre mice have significantly decreased comodulation between broadband γ amplitude and 0.5-2 Hz phase compared with PV-Cre/NR1f/f mice (PV-Cre: 0.0009 ± 0.0001; PV-Cre/NR1f/f: 0.0100 ± 0.0023; Wald χ2 = 195.638, p < 0.00001, LMM; right, CI from bootstrap analysis: [8.77, 15.29]). C, G, Black lines indicate median. Dots indicate 30 s epochs. Dashed line indicates baseline. K (violin plots), Solid line indicates mean. Dashed line indicates median. K (bootstrap plot), Solid line indicates mean. Dashed line indicates 95% CI. Two-tailed unpaired t test was used to assess significance if data passed the D'Agostino & Pearson normality test; if not, the Mann–Whitney test was used. The Kolmogorov–Smirnov test was used to assess significance between CDFs, and complemented with an LMM and a bootstrap analysis to assess significance between PV-Cre and PV-Cre/NR1f/f mice while accounting for intragroup variability. Complementary statistical information can be found in Extended Data Figure 9-1.
