
Fig. 5.
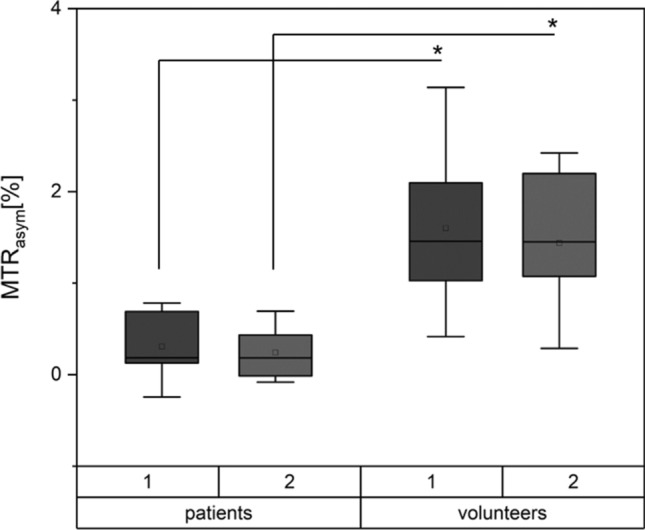
Comparison of MTRasym values in patients and healthy volunteers. Data are presented as means (thick line), medians (square boxes), standard deviation (boxes), and ranges (whiskers). For each cohort, two separate boxes are presented: 1 gives the MTRasym values of the ROI defined by rater 1. Box 2 depict the MTRasym values of the corresponding ROIs of rater 2. p values < 0.05 were considered significant and are highlighted with an asterisk