Fig. 3.

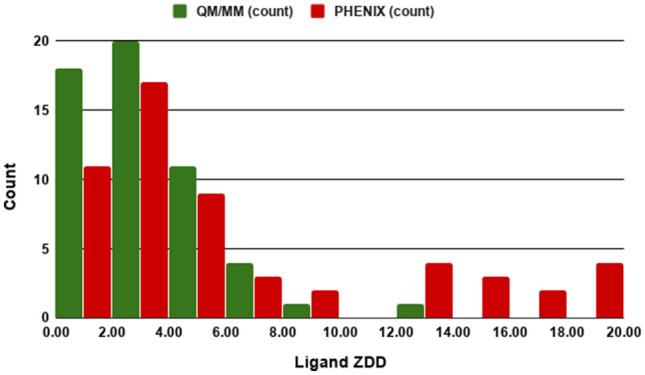
Histogram of Ligand Z-score of the difference density (ZDD) distributions for ligands from 55 CSAR structures refined using QM/MM method and conventional PHENIX. The lower the ZDD the more accurate the model versus the experimental density

Histogram of Ligand Z-score of the difference density (ZDD) distributions for ligands from 55 CSAR structures refined using QM/MM method and conventional PHENIX. The lower the ZDD the more accurate the model versus the experimental density