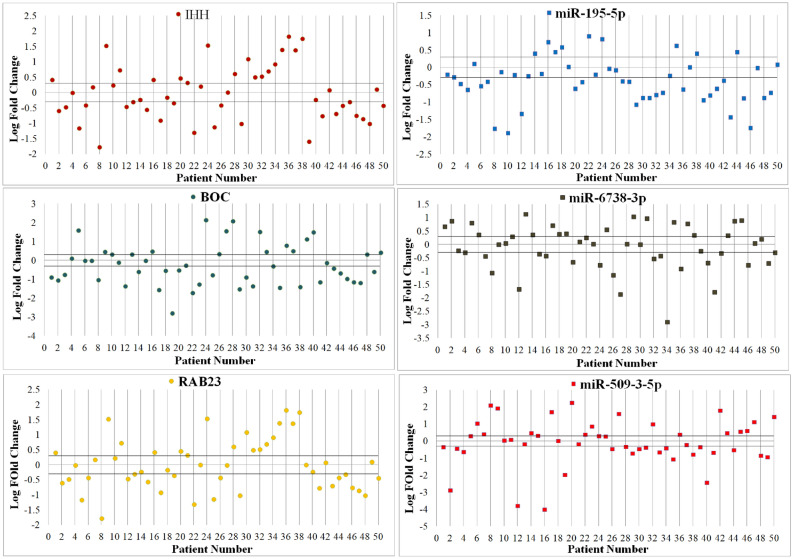
Figure 2.
Scatter plot expression of Shh signaling pathway genes and their regulatory miRNAs in tumoral and adjacent non-tumoral tissues. Gene expression variations were considered in 50 gastric adenocarcinoma patients. Each plot represents a person’s gene expression change in tumor tissue in comparison with adjacent normal tissue. Horizontal lines represent cut-off values corresponding to log two-fold changes in expression. The upper and lower parts of the horizontal lines indicate upregulation, and downregulation in the tumoral tissues in comparison with non-tumoral tissues, respectively.

