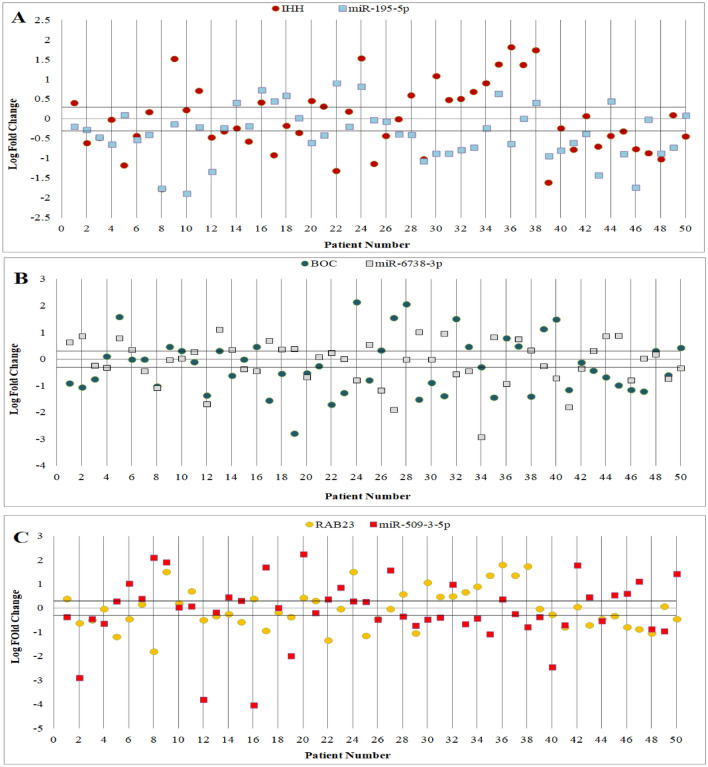
Figure 3.
Scatter plot of gene expression in tumoral and adjacent non-tumoral tissues of 50 gastric adenocarcinoma patients. Each plot represents a person’s gene expression change in tumor tissue compared with adjacent normal tissue. Horizontal black lines represent cut‐off values (log2 fold changes in expression). Cases above the upper line demonstrated overexpression in tumoral in comparison with non-tumoral tissues, and those below the lower line demonstrated lower expression levels (differences in expression ≥ 2; P < 0.05).

