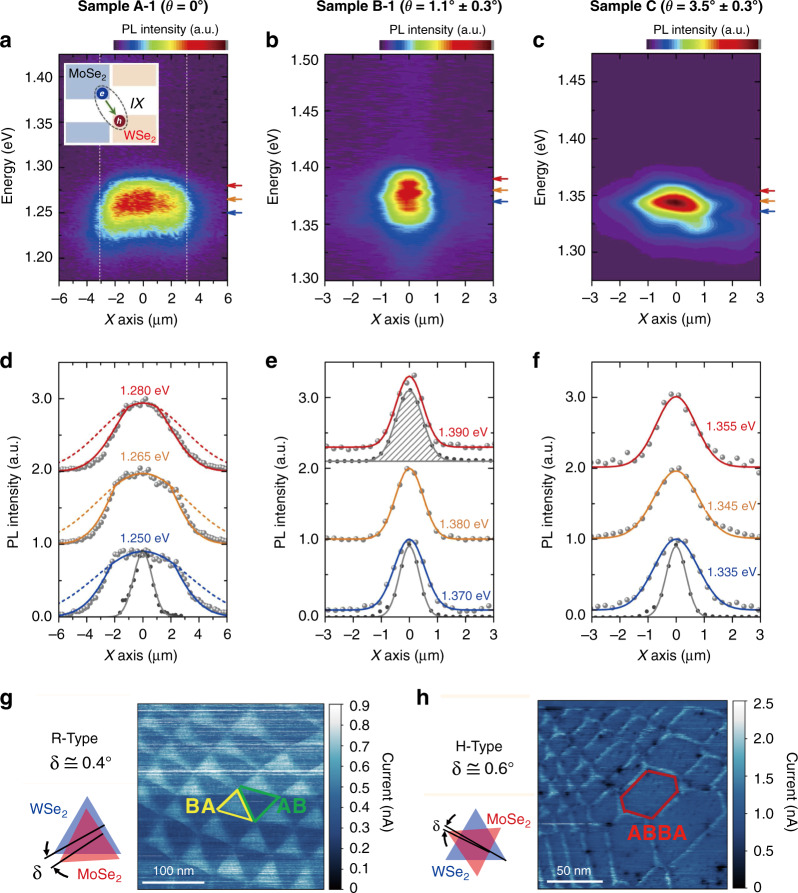
Fig. 10. Interlayer exciton diffusion at different twist angles.
a–c Spatially resolved PL images of interlayer excitons in MoSe2/WSe2 heterostructures prepared by the CVD growth method (a sample A-1) and mechanical exfoliation and transfer method with a twist angle of 1.1° ± 0.3° (b sample B-1) and a twist angle of 3.5° ± 0.3° (c sample C)162. d–f PL line profiles extracted from a–c for the three samples at a few selected energies. The PL line profiles for sample A-1 are truncated by the boundaries of the heterostructure region (the white dashed lines in a)162. The 660 nm excitation laser profile and the 900 nm laser profile are represented by the bottom gray lines and the top gray shaded area, respectively. The PL spot size of the interlayer exciton (PL wavelength near 900 nm) shown in Fig. 10e is slightly larger than the excitation laser (660 nm) spot size because of the imaging optics at different wavelengths. A Gaussian function was used to fit the measured data points. g Atomic reconstruction in the R-type MoSe2/WSe2 heterostructure with a small twist angle (δ) of ~0.4°194. The yellow and green triangles represent the triangular domains with BA and AB stacking, respectively. h Atomic reconstruction in the H-type MoSe2/WSe2 heterostructure with a small twist angle (δ) of ~0.6°194. The red hexagon represents the hexagonal domain with ABBA stacking. a–f Reprinted with permission from ref. 162 [American Association for the Advancement of Science]. g, h Reprinted with permission from ref. 194 [American Chemical Society]

