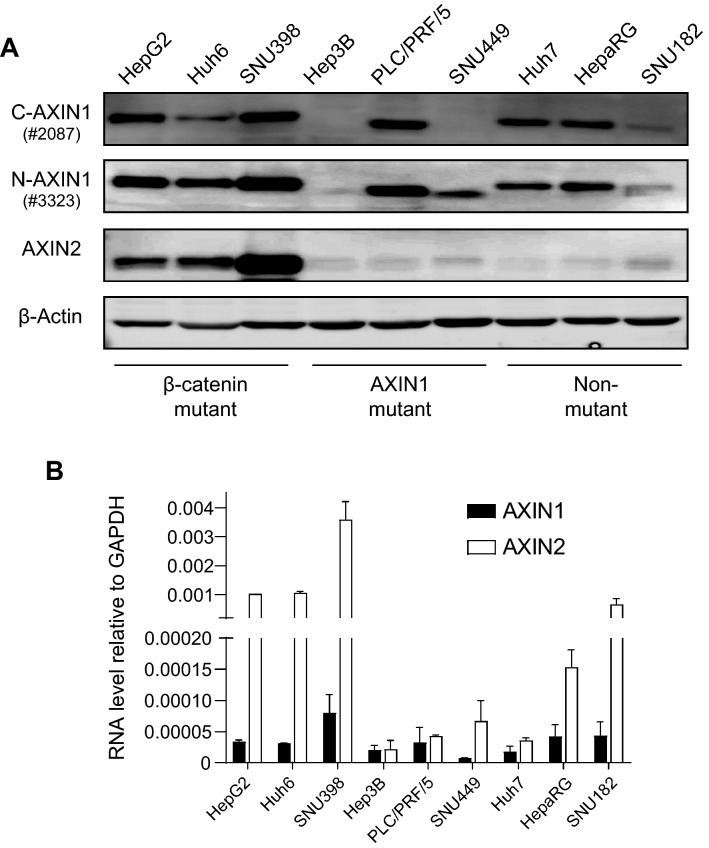
Figure 1.
Baseline levels of AXIN1 and AXIN2 in HCC cell lines. (A) Western blotting assay showing the basal protein levels of AXIN1 and AXIN2. For AXIN1 both N-terminal and C-terminal antibodies were used, respectively, #3323 and #2087 from Cell Signaling Technology. (B) RNA levels tested by TaqMan qRT-PCR (mean ± SD, n = 2, twice). All expression levels are depicted relative to the housekeeping gene GAPDH. Note the interrupted Y-axis scale.

