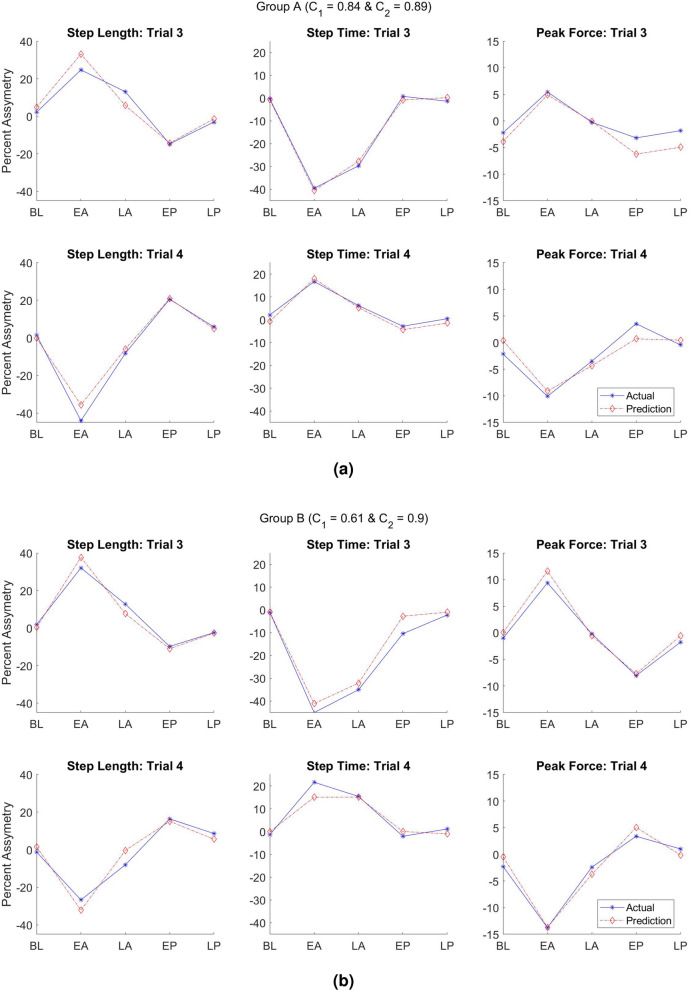
Figure 4.
Linear model predicting the asymmetric performance of step length, step time, and peak vertical force compared to real data during trial 3 and 4. The predictions are the dashed red lines, and the actual results from experiments are solid blue lines. (a) Group A actual data and model with the coefficients C1 = 0.84 and C2 = 0.89, (b) Group B actual data and model with the coefficients C1 = 0.61 and C2 = 0.90. The top row in each group represents the linear model and real data for the congruent combination (trial 3), and the bottom row represents the linear model and real data for the incongruent combination (trial 4).

