Figure 3.
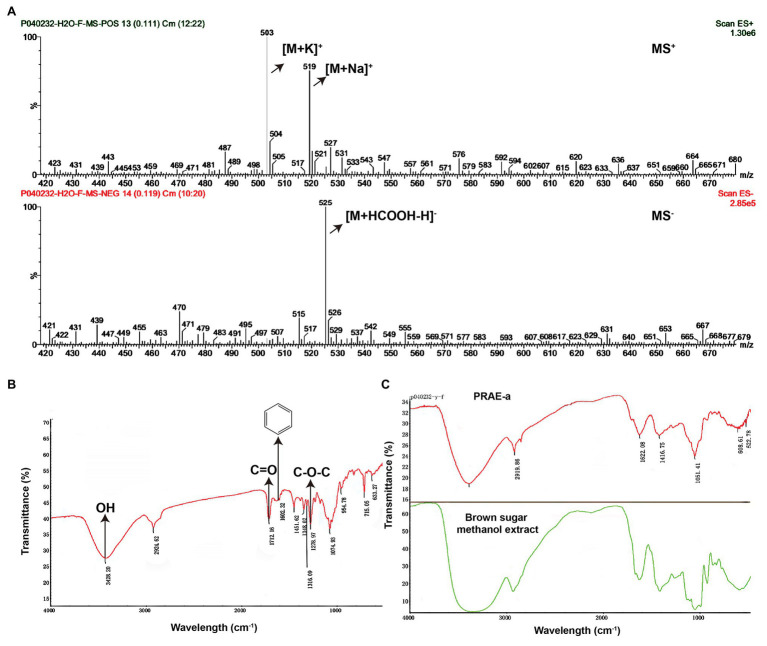
Mass spectrometry and Fourier transform infrared spectrometer analysis of the structures in the extract compounds. (A) Mass spectrometry (MS) analysis showed that there is a chemical in the extract which has a paeoniflorin-like structure. The MS+ (upper) showed that the peaks of [M + Na]+ are at m/z = 503 and [M + K]+ at m/z = 519. The MS− (bottom) showed the peak of [M + HCOOH-H]− is at m/z = 525. (B) Fourier transform infrared spectrometer (FTIR) determination indicated that PRAE-a, a main component in the extract, is similar in structure to paeoniflorin. The signals that represent hydroxy, carbonyl group, benzene ring, and ether bond appeared, respectively, at the positions of wavelengths of 3428, 1712, 1602.32, and 1279 cm−1, which matched with the observations at the wavelengths for the assay of the chemical paeoniflorin. (C) The extract had the structure of a carbohydrate. The brown sugar methanol extract (green line) had a similar formation in the wavelength to the extract (red line).

