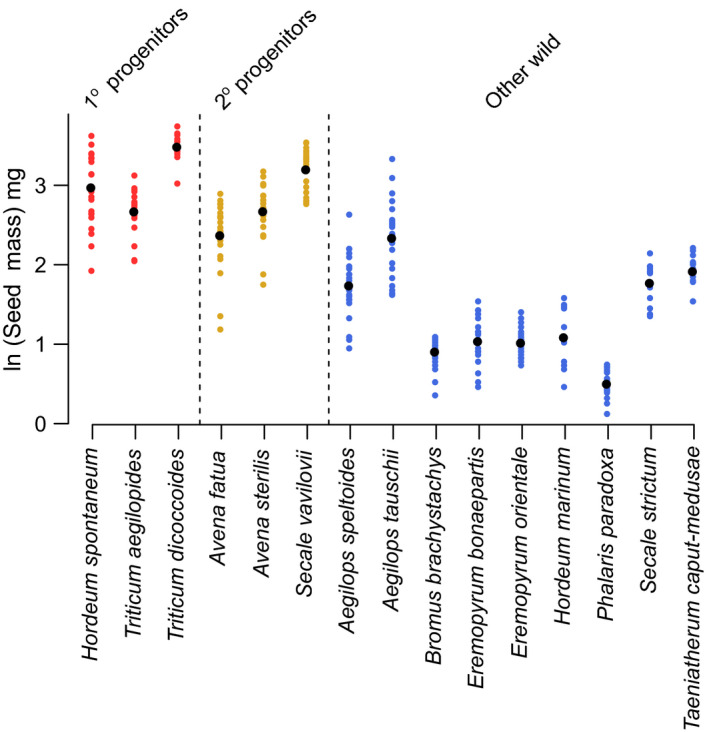
Figure 1.

Natural‐logged seed mass for each species (mg). For each species, the small colored points show data for individual replicates while the large black points are the species means. Crop progenitors were significantly larger seeded than other wild species when the secondary crop progenitors were excluded (p <.01), and when the secondary progenitors were included as wild species (p <.05) and as crop progenitors (p <.001)
