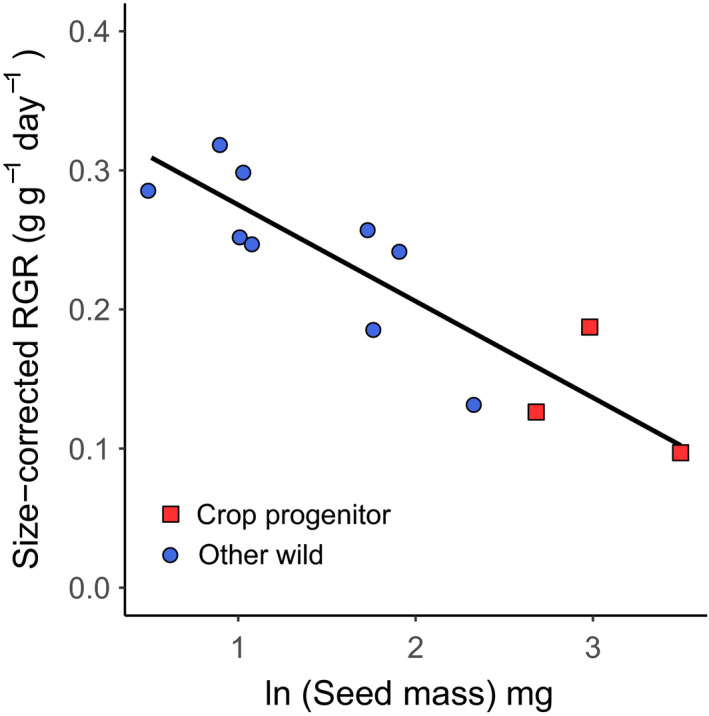
Figure 2.

The relationship between size‐corrected relative growth rate and natural log transformed individual seed mass. Each point is a species, with red squares showing primary crop progenitors, and blue circles showing other wild species. Significant effect of seed mass (slope = −0.07, p <.001)
