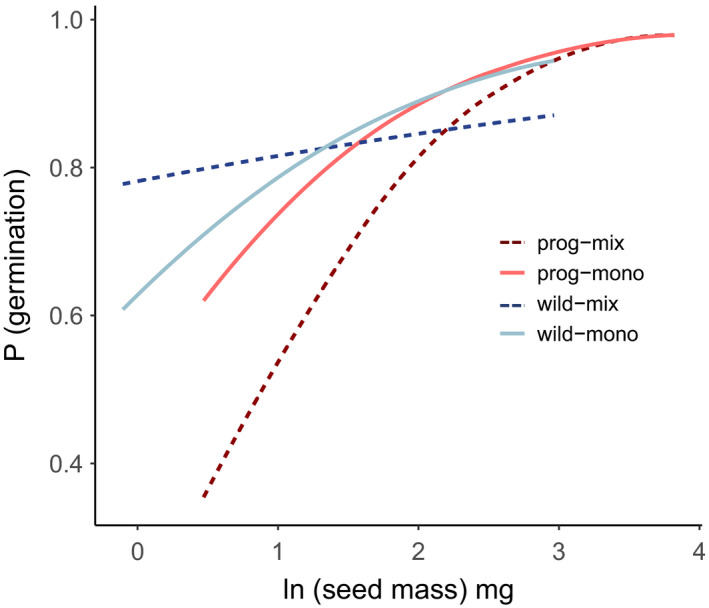
Figure 4.

Germination success shown as the proportion of germinating seeds varying with ln(seed mass), domestication status (prog = progenitor) and stand type (mix = mixture, and mono = monoculture). Results are plotted from the estimates of a generalized linear mixed effects model, with a three‐way interaction between seed mass, domestication status, and stand type (p <.05). Data are plotted over the range of seed size found for crop progenitors (1.6–45.7 mg) and other wild species (0.9–19.4 mg). In mixtures, seed size increase was more beneficial for crop progenitors (dark red dashed line) compared with wild species (dark blue dashed line)
