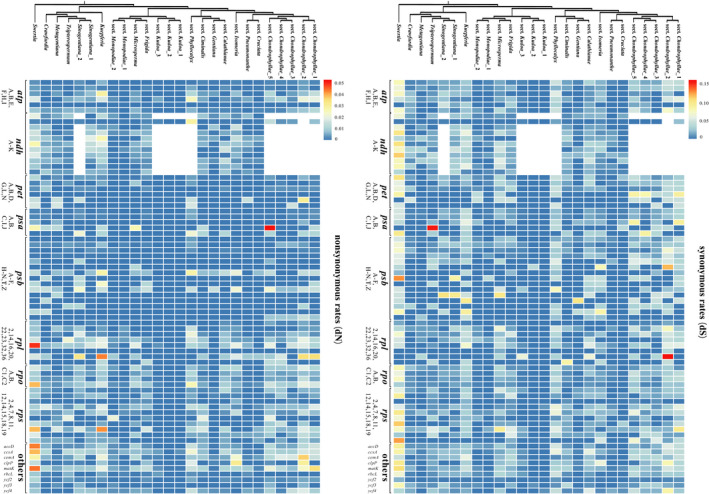
FIGURE 3.

Rate variation in subtribe Gentianinae. Heatmaps illustrate differences in dN and dS for each plastid protein gene. Low rates are shown in blue, and high rates in red. The phylogenetic topology is from the maximum likelihood analysis of protein coding genes presented in Figure 1
