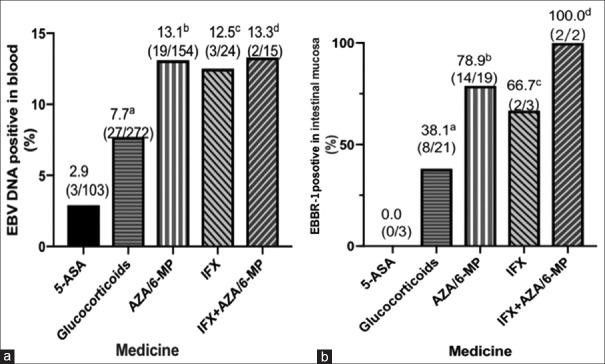
Figure 2.
(a) Percentage of patients with EBV DNA in blood in different groups. aP, 0.09, glucocorticoids versus ASA; bP, 0.008, AZA/6-MP versus ASA; cP, 0.045, IFX versus ASA; dP, 0.048, AZA/6-MP + IFX versus ASA (b) Percentage of patients with EBER-1 positivity in mucosal in different groups. aP, 0.151, glucocorticoids versus ASA; bP, 0.014, AZA/6-MP versus AZA; cP, 0.083, IFX versus ASA. dP, 0.025 AZA/6-MP + IFX versus ASA

