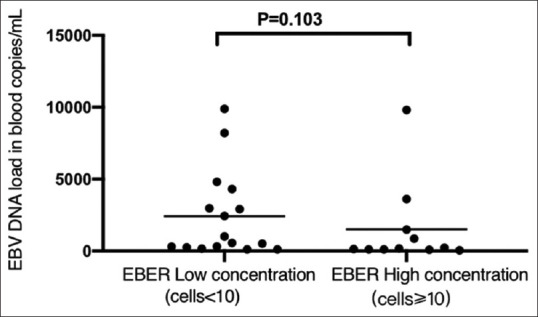
Figure 3.

The comparison of EB-DNA load in blood between low EBER concentration group and high EBER concentration group in intestinal mucosa. Wilcoxon test reveals that the EBV load in blood of high EBER concentration group is not any higher than that of low EBER concentration group (P = 0.103)
