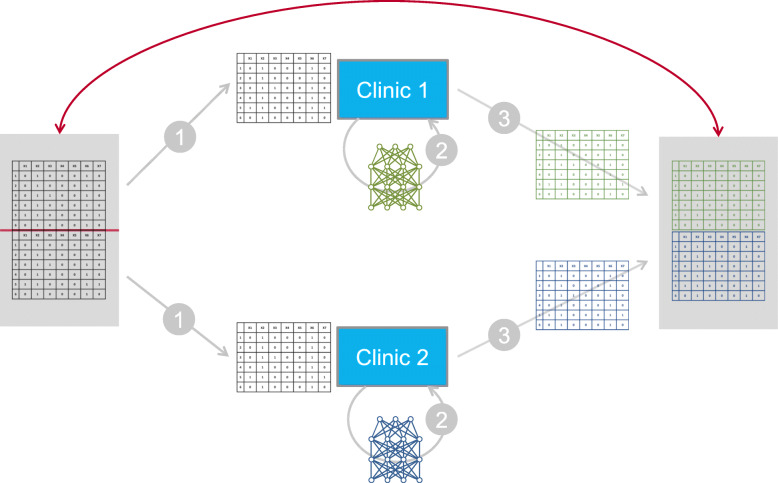
Fig. 4.
Sketch of the experimental setup for the comparison of original and generated data. In the first step, the original data is split into a number of smaller data sets, which are distributed in equal shares, consisting of consecutive parts of the data set, to the virtual sites. (For simplicity, only two sites/clinics are shown.) In step 2, separate generative models are trained at each site on their share of the data. In step 3, synthetic data are generated by each of the models and compiled to again form one overall data set. This synthetic data set will be visually compared to the original data set. For the results, see Fig. 5 below

