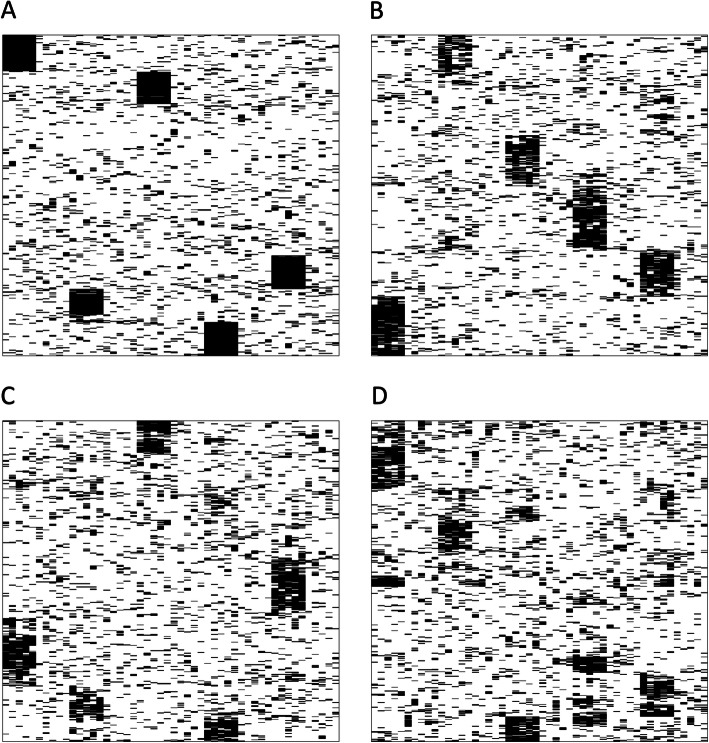
Fig. 5.
Hierarchical clustering view of a data set and associated synthetic data sets. The rows are the patients and the columns are the variables. The rows are clustered hierarchically [34]. Panel a shows the original data set, panel b shows data generated from one DBM that has been trained on the original data. Panels c and d show outputs of the experiment conducted with 2 and 20 sites, respectively. The SNP sets with the five consecutive 1s appear as black blocks in the hierarchical clustering view. The vertical positions of the black blocks change across the different sub plots because the noise in the other variables also influences the clustering. The horizontal position of the blocks, which is determined by the position of the genetic features, is the same in all four plots

