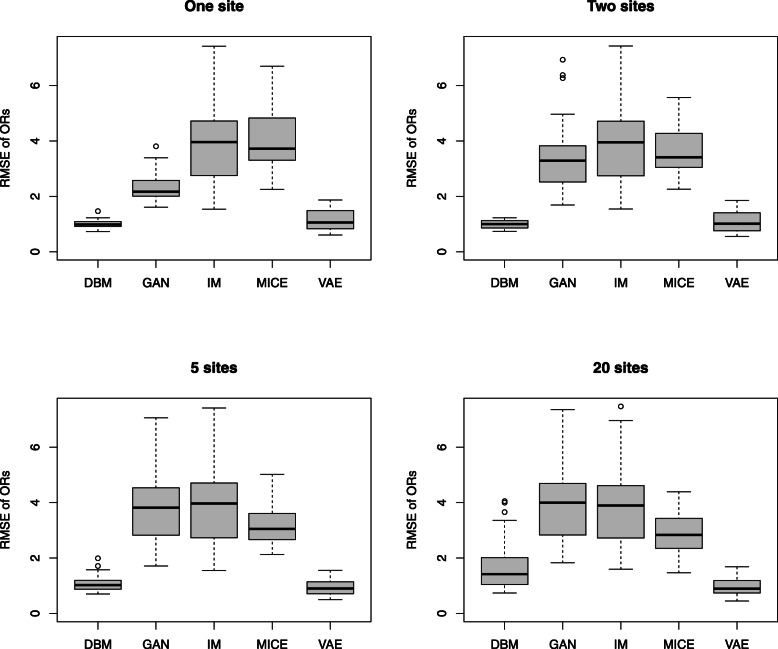
Fig. 6.
Performance comparison of the different model types based on odds ratios. The performance is quantified by the distance (rooted mean squared error) between log odds ratios computed from generated samples and validation data. Each model is evaluated on the same 30 different data sets. Each of the 30 data sets contains genetic variation data from 50 SNPs from randomly selected genetic locations. As shown in Fig. 4, the original data sets with 500 samples (chromosomes) are equally split into two, five and 20 sites, respectively. Results are shown for the combined generated data sets collected from the sites

