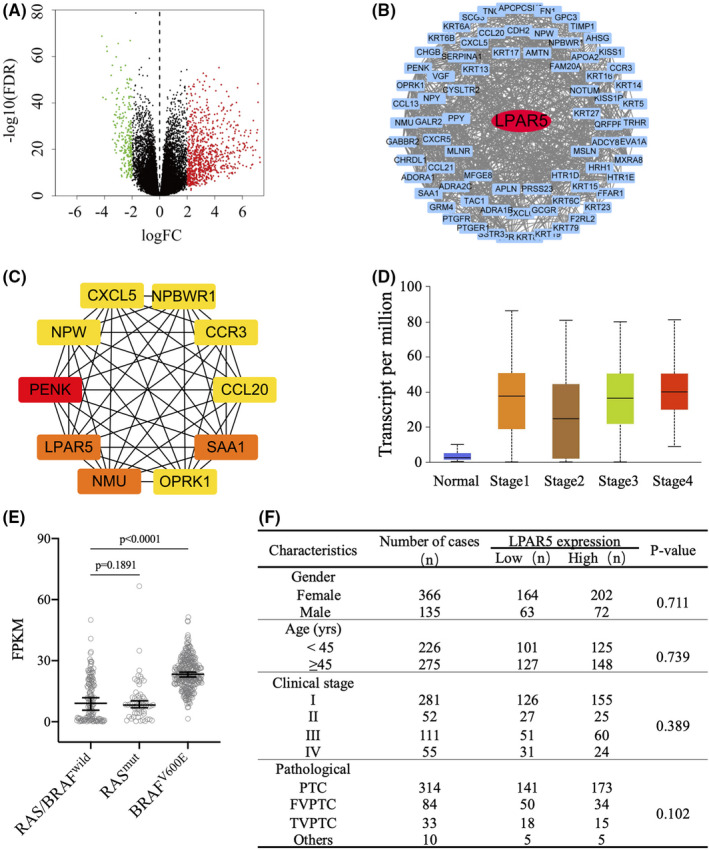
FIGURE 1.

Analysis of lysophosphatidic acid receptor 5 (LPAR5) expression profile using data from TCGA. A, Volcano plots of differentially expressed genes (DEGs) between thyroid cancer and normal thyroid tissue. Red: upregulation; green: downregulation; black plots: normally expressed mRNAs. B, The protein‐protein interaction (PPI) network was constructed by MCODE. Red nodes represent the seed DEGs in the network. C, The top 10 hub genes were identified by cytoHubba. The higher the MCC ranking, the darker the red color. D and E, LPAR5 differently expressed in different stages of papillary thyroid carcinoma (PTC) tissues, RAS‐like or BRAFV600E‐like PTC tissues. F, The relationship between clinicopathological data and LPAR5 expression from TCGA database
