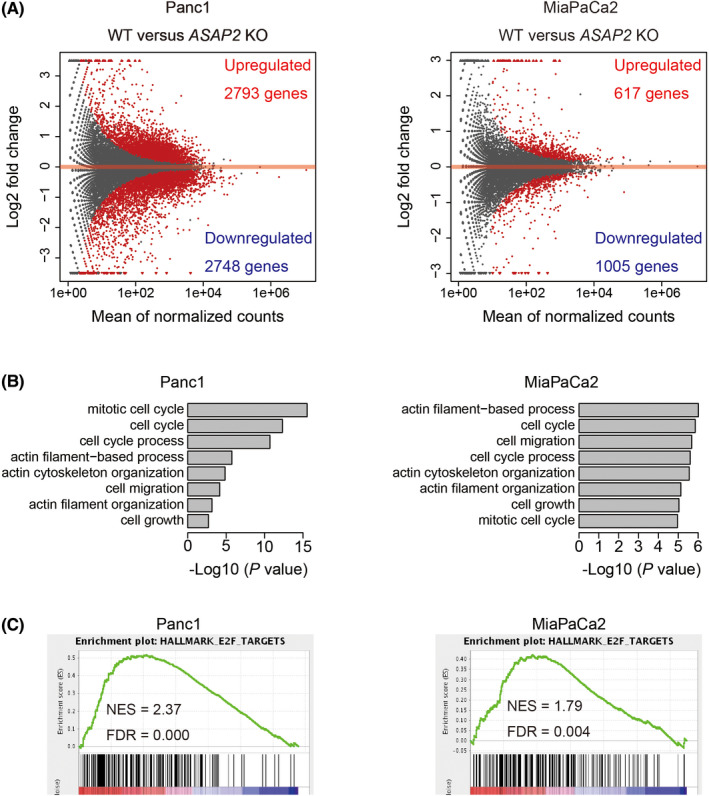
FIGURE 2.

RNA sequencing of ASAP2 knockout cells and wild‐type cells. A, MA plot of differentially expressed genes (DEGs) comparing wild‐type and ASAP2 knockout Panc1 and MiaPaCa2 cells. DEGs are represented as red dots. B, GO analysis of significantly upregulated genes in wild‐type cells. C, GSEA plots for selected hallmark gene sets
