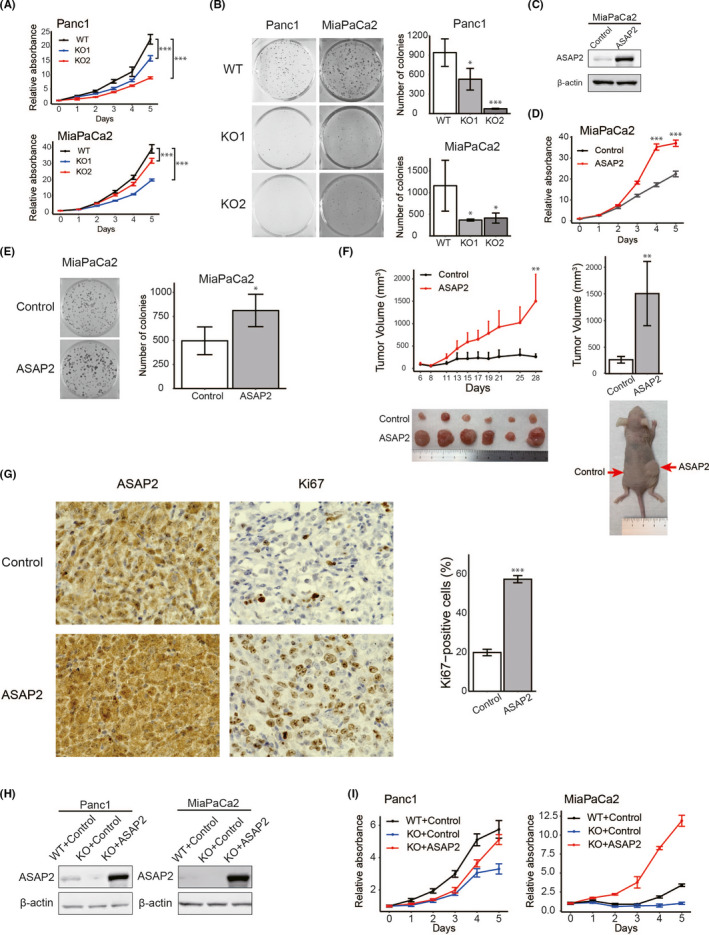
FIGURE 4.

ASAP2 is associated with growth of PDAC cells. A, MTT assays using ASAP2 knockout Panc1 and MiaPaCa2 cells. (***) P < .001. B, Colony formation assays using ASAP2 knockout Panc1 and MiaPaCa2 cells. (*) P < .05; (***) P < .001. C, ASAP2 protein expression was assessed by western blot analysis of MiaPaCa2 cells stably overexpressing ASAP2 and control cells. D, MTT assay using MiaPaCa2 cells stably overexpressing ASAP2. (***) P < .001. E, Colony formation assay using MiaPaCa2 cells stably overexpressing ASAP2. (*) P < .05. F, In vivo analysis using a tumor xenograft model. The growth curve of xenograft tumors from MiaPaCa2 cells stably overexpressing ASAP2 (n = 6) and control cells (n = 6) (left). Bar graphs represent the tumor volume, respectively (right). (**) P < .01. G, Immunohistochemical staining for ASAP2 and Ki67 in tumor tissues from control cells and MiaPaCa2 cells stably overexpressing ASAP2 (left). Bar graphs represent the percentage of Ki67‐positive cells in tumor tissues from MiaPaCa2 cells stably overexpressing ASAP2 (n = 6) and control tumor tissues (n = 6) (right). Original magnification, ×600. (***) P < .001. H, ASAP2 protein levels in the indicated cells. ASAP2 protein expression using western blot analysis in these rescued cells. I, MTT assay using indicated cells
