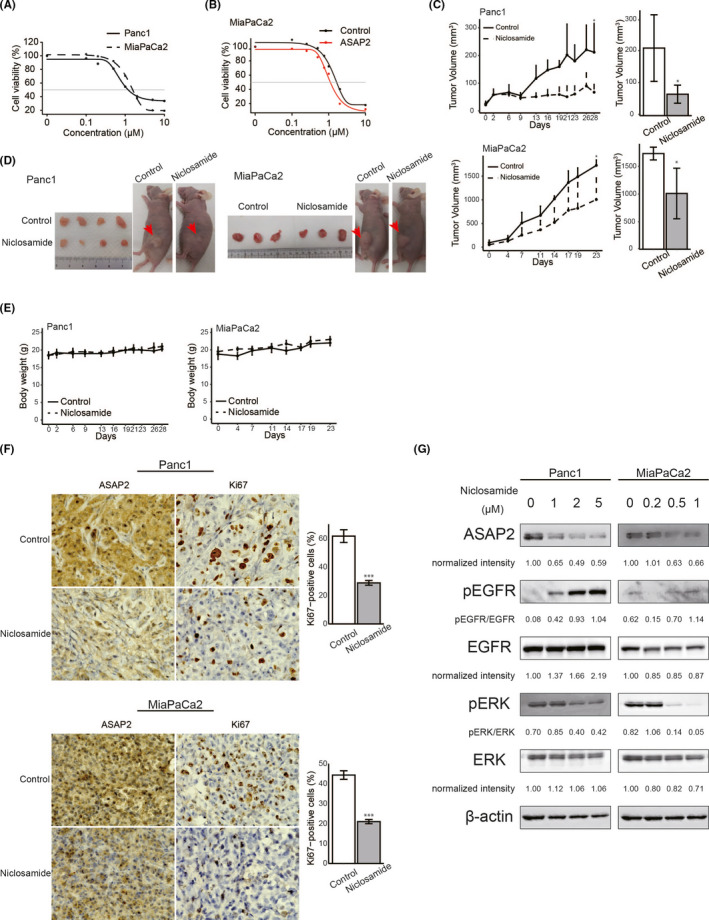
FIGURE 7.

Niclosamide inhibited the growth of PDAC cells in vitro and in vivo. A, B, Sensitivity of PDAC cells to niclosamide. Cell viability was measured using MTT assays in PDAC cells treated with the indicated concentrations of niclosamide for 48 h. A, MTT assay using Panc1 and MiaPaCa2 cells. B, MTT assay using MiaPaCa2 cells stably overexpressing ASAP2 and control cells. C, Panc1 and MiaPaCa2 tumor growth in control (n = 4) and niclosamide‐treated mice (n = 4). Bar graphs represent the tumor volume, respectively. (*) P < .05. D, Subcutaneous tumors from control and niclosamide‐treated mice. E, Body weights of control and niclosamide‐treated mice during the entire experimental period. F, Immunohistochemical staining for ASAP2 and Ki67 in tumor tissues from control and niclosamide‐treated mice. Bar graphs represent the percentage of Ki67‐positive cells in tumor tissues from control (n = 4) and niclosamide‐treated mice (n = 4). Original magnification, ×600. (***) P < .001. G, Panc1 and MiaPaCa2 cells treated with the indicated concentrations of niclosamide for 48 h were analyzed to determine the levels of phosphorylated or total ERK and the expression of ASAP2 using western blotting. β‐Actin was used as the loading control for relative protein quantification. The normalized intensities of each protein and ratios of pEGFR/EGFR and pERK/ERK are shown
