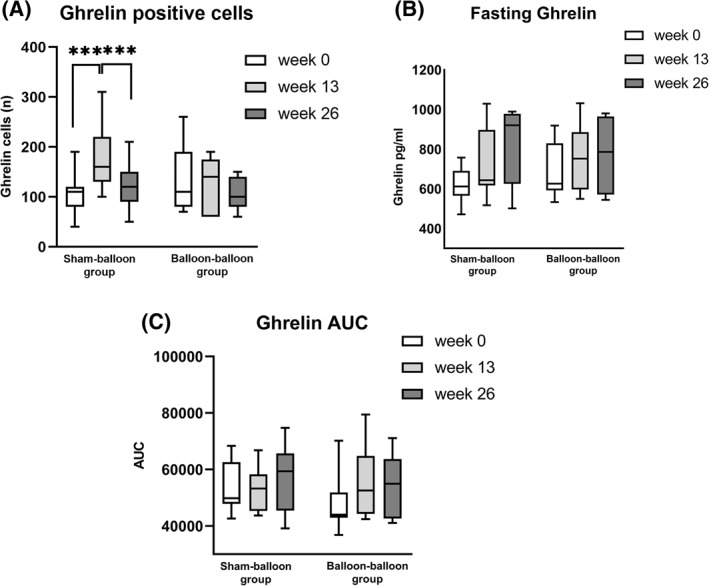
FIGURE 4.

(A) Box‐and‐Whisker plot diagram of the number of ghrelin positive cells in the fundus at the start, after 13 and after 26 weeks in the sham–balloon group and the balloon–balloon group. There were no differences between the groups. Within the groups, the number of ghrelin cells increased significantly (p 0.001) during the period of sham treatment in the sham‐balloon group and decreased significantly (p 0.001) during their first balloon treatment. *** signifies p 0.001. (B) Box‐and‐Whisker plot diagram of fasting ghrelin levels (pg/ml) at the start, after 13 and after 26 weeks in the sham–balloon group and the balloon–balloon group. No differences were seen between and within groups. (C) Box‐and‐Whisker plot diagram of the meal‐related ghrelin secretion expressed as area under the curve of ghrelin secretion for 1 h at the start, after 13 and after 26 weeks in the sham–balloon group and the balloon–balloon group. No differences were seen between and within groups
