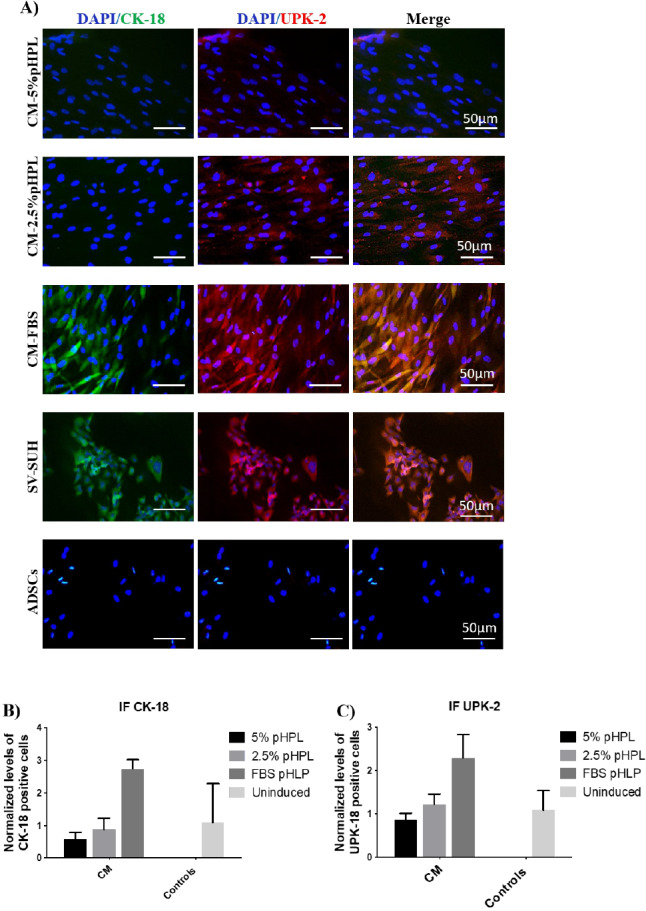
Figure 4. Immunofluorescence staining of urothelial markers at the cellular level.

(A) ADSCs cultured in CM and different concentrations of pHPL (5% & 2.5%) or with FBS, were assessed for the expression of cytokeratin-18 (FITC, green) and uroplakin- 2 (Cy3, red). SV-HUC cells were used as a positive control, meanwhile ADSCs were utilized as a negative control. Scale bar = 50 µm. (B & C) Semi-quantitative analysis of immunoflouresence representing percentage of positive cells relative to negative control. All experiments were repeated at least three times.
