Abstract
Background & Aims:
The region of the esophagus 15–17 cm below the incisors, called the sub-upper esophageal sphincter (sub-UES), has not been characterized in adults with eosinophilic esophagitis (EoE) but appears different during endoscopy. We investigated how the sub-UES differs from the remaining esophagus in patients with EoE and aimed to determine whether these differences be used to distinguish patients with EoE from those with lichen planus.
Methods:
We performed a prospective study of 14 patients with EoE, 7 patients with lichen planus (based on presence of Civatte bodies, dysphagia, and/or narrow esophagus with thin esophageal mucosa without signs of EoE), and 20 patients undergoing upper endoscopy for upper gastrointestinal or with dysphagia but without features of EoE (controls) at a single medical center from 2015 through 2018. Biopsies from the distal, middle, and sub-UES regions of the esophagus were analyzed by histology, quantitative PCR, and immunohistochemistry. We measured mucosal impedance (MI) in all subjects at the sub-UES and 2 cm, 5 cm, and 10 cm from the gastro-esophageal junction.
Results:
Patients with EoE had significantly fewer eosinophils (median, 2 eosinophils/high-powered field [HPF]; range, 0–8 eosinophils/HPF) in sub-UES tissues compared with distal esophagus (median, 50 eosinophils/HPF; range, 22.5–60.8 eosinophils/HPF; P<.0001) or middle esophagus (median, 32 eosinophils/HPF; range, 19.3—60; P<.0001). Sub-UES tissues from patients with EoE had significantly less basal cell hyperplasia (P<.01), papillary elongation (P<.01), and dilated intercellular spaces (P<.01) than middle or and distal esophagus. MI in the sub-UES did not differ significantly between patients with EoE vs controls (P=.24), but was significantly lower in patients with lichen planus (median, 1344 ohms; range, 1046–1488) than patients with EoE (median, 2880 ohms; range, 2149–4858) (P<.001). mRNA and protein expression patterns did not differ significantly in the sub-UES of patients with EoE vs controls, except for expression of desmoglein-1, which was increased in sub-UES tissues from patients with EoE.
Conclusions:
Sub-UES tissues from patients with EoE differ in numbers of eosinophils, histologic features, and MI compared to controls or patients with lichen planus. These features might help to distinguish these 2 diseases.
Keywords: mucosal impedance, diagnosis, inflammation, DSG1 expression
INTRODUCTION
Eosinophilic Esophagitis (EoE) is a chronic inflammatory disorder of the esophagus with increasing incidence and prevalence.1–3 While significant advances have been made in understanding its genetic underpinnings,4,5 eosinophil recruitment and activation,6,7 and epithelial barrier dysfunction,8–11 the pathophysiology remains incompletely understood. Since EoE is characterized by epithelial barrier dysfunction,12 our group has employed a minimally invasive device to measure mucosal impedance (MI) as a reflection of epithelial integrity in esophageal disorders, including EoE.13–15 We have previously demonstrated that EoE has a distinct MI pattern when measured at 2,5, and 10 cm from the gastroesophageal (GE) junction and that this pattern can be used to accurately distinguish EoE from GERD.16 However, the region of the esophagus 17 cm from the incisors, just below the upper esophageal sphincter (i.e. the sub-UES) has not been characterized in adult EoE patients.
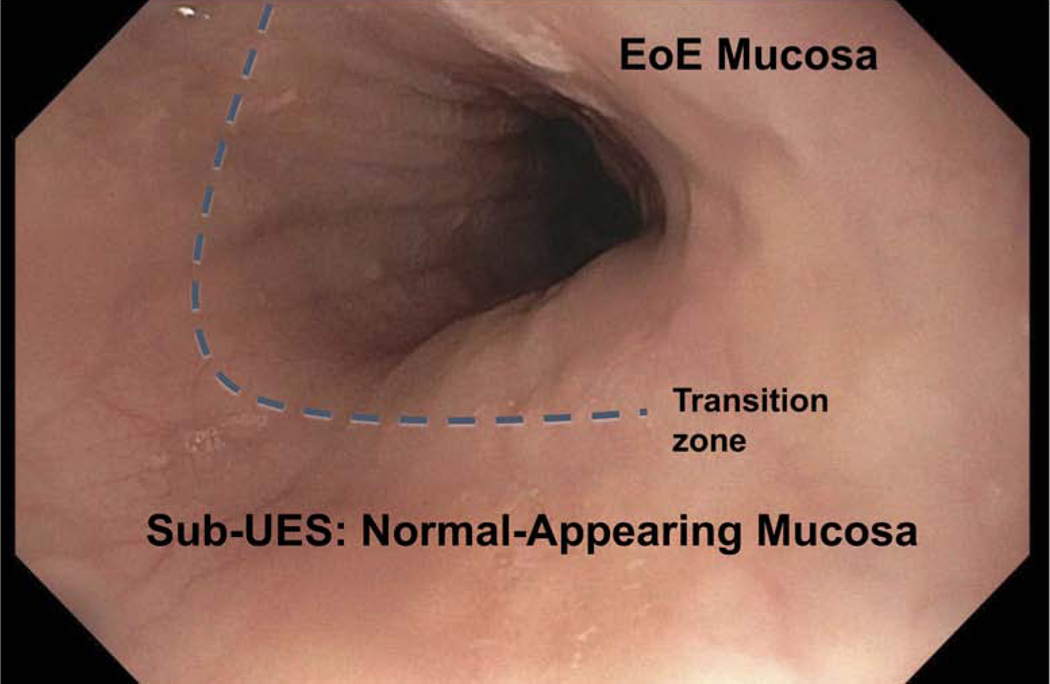
During upper endoscopy, we observed that the mucosa in the sub-UES region of patients with active EoE (defined as > 15 eosinophils/high power field in mucosal biopsies) frequently appeared normal as compared with the rest of the esophagus (Figure 1). Based on this observation, we hypothesized that epithelial barrier dysfunction in EoE is not pan-esophageal (i.e. does not extend to the sub-UES). Our initial aim was to determine eosinophilic infiltration, histologic features, and assess for mRNA expression of EoE candidate genes in the sub-UES region of patients with active EoE. After collecting tissue from the first 9 patients, we expanded our aims to include MI, which we recorded in the remaining patients. We then compared MI in EoE with lichen planus (LP) patients. At the end of the study, we performed IHC for some of the same candidate genes to confirm that changes at the mRNA level were also changed at the protein level.
Figure 1: Sub-UES mucosa appears normal in patients with active EoE.
Endoscopic image of esophagus 17 cm from incisors. Mucosa appears normal in sub-UES region in patients with active EoE.
METHODS
This study was performed in accordance with the Declaration of Helsinki, Good Clinical practice and applicable regulatory requirements. The Vanderbilt University Institutional Review Board approved the study protocol (IRB# 120126). Supplementary methods provide more details about patient selection and methodology.
Study design and population:
This is a prospective study, where 41 patients were enrolled (Supplemental Figure 1). The study population consisted of 14 patients with active EoE, 20 controls, and 7 LP patients. The LP patients were separate from controls. Patients with confirmed EoE had dysphagia and histologic confirmation (>15 eosinophils per high-power field in distal or mid esophageal biopsy specimens). Controls were defined as patients undergoing upper endoscopy for upper gastrointestinal symptoms non-responsive to proton pump inhibitor (PPI) therapy or being evaluated for dysphagia. Controls did not have evidence of reflux esophagitis, eosinophilic infiltration of mucosal biopsies, or reflux-induced stricture requiring dilation. Patients were excluded from the study if they were below 18 years of age, had achalasia, diffuse esophageal spasm, Barrett’s esophagus, history of esophageal surgery, gastrointestinal cancer, or peptic ulcer disease. Tissue was collected between 2015–2017.
Lichen planus patients were defined by pathognomonic findings, i.e. Civatte bodies, clinical presentation (dysphagia in middle aged females), and/or endoscopic appearance (narrow esophagus with thin esophageal mucosa without the classic signs for EoE).
Mucosal impedance:
A previously described MI catheter13.14 was engineered to measure electrical resistance of the esophageal lining by direct mucosal contact. The MI catheter was guided by the physician through the working channel of the endoscope and MI measurements were obtained at 2, 5, and 10 cm above the GE junction in addition to the sub-UES. The sensors remained in contact with the mucosa at each location for 5 seconds after a stable impedance reading was obtained.
Histologic analysis:
Biopsy specimens were obtained from distal (2 cm from GE junction), mid (5–10 cm from GE junction), and sub-UES and stained with hematoxylin and eosin (H&E). A cut-off of more than 15 eosinophils per high-power field (eos/HPF) in distal or mid biopsy specimens was required to make the diagnosis of EoE. An experienced GI pathologist (M.K.W.) was blinded to the region of the esophagus, patient characteristics, endoscopic findings, and MI measurements. All three specimens (distal, mid, and sub-UES) were submitted for histologic analysis. Specimens were scored for other features of EoE,17 including basal cell hyperplasia, dilated intercellular spaces, elongation of papillae, lamina propria fibrosis, eosinophil distribution, eosinophil abscess, eosinophil surface layering, and eosinophil degranulation.
qPCR and Immunohistochemistry:
Please see supplemental methods.
Comparison of EoE patients with sub-UES eosinophils vs. those without
At the end of the study we retrospectively compared the number of endoscopies, number of food impactions, and number of therapeutic escalations that occurred after the initial endoscopy for the study. Escalations were defined as dilations performed, medication changes or dose increases, and/or addition of food elimination diet. Data was extracted from the electronic medical record for an average of 1 year after their initial endoscopy via clinic visits, phone calls, or visits for subsequent endoscopies.
Statistical Analysis:
Analyses comparing two groups were analyzed using the Mann-Whitney non-parametric test, while the Kruskal-Wallis test was used to compare multiple groups. Data are presented as the median, 25%−75% (i.e. median with IQR) in all graphs. All analyses were performed using GraphPad Prism®8.0c (San Diego, CA, USA). P<0.05 was considered statistically significant.
RESULTS
Patient Demographics:
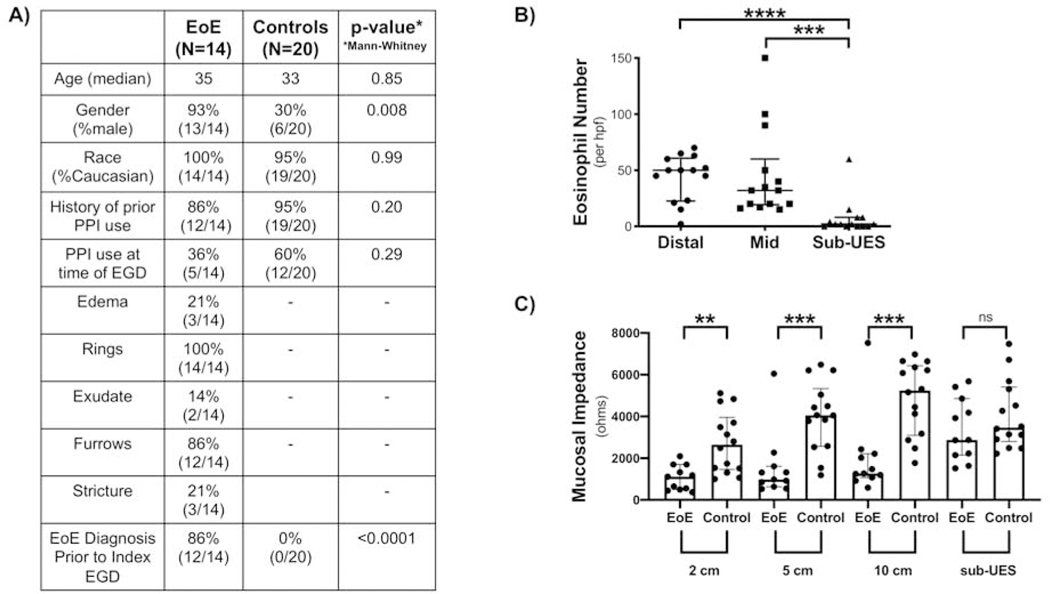
A total of 14 EoE patients and 20 controls were enrolled. There was no difference in age, race, history of taking PPI, or PPI use at the time of endoscopy between the two groups, but there was a significantly increased number of males in the EoE group (Figure 2A). This is consistent with a known male predominance in EoE.18–20 Histologic analysis was done on all EoE patients, while quantitative real time PCR (Figure 4A) and IHC (Figure 5A) were done based on available tissue/sections.
Figure 2: Sub-UES region in patients with active EoE exhibits significantly fewer eosinophils and normal mucosal impedance.
(A) Patient Demographics. (B) There are significantly fewer eosinophils in the sub-UES region of patients with active EoE (****P<0.0001), as compared with distal (****P<0.0001, 2, 0–8 vs. 50, 22.5–60.8, n=14) and mid (****P<0.0001, 2, 0–8 vs. 32, 19.3–60 n=14) esophagus. (C) Mucosal Impedance (MI) is significantly lower at 2 cm (**P<0.01, 1110, 498.7–1694 vs. 2647, 1457–3959, n=11–14), 5 cm (****P<0.0001, 977.4, 630–1609 vs. 4059, 2570–5337, n=11–14) and 10 cm (***P<0.001, 1264, 1073–2219 vs. 5240, 3099–6429, n=11–14) from the GE junction in patients with active EoE but has no difference in the sub-UES region (P=0.24, 2880, 2149–4858, vs. 3471, 2803–5407, n=11–14).
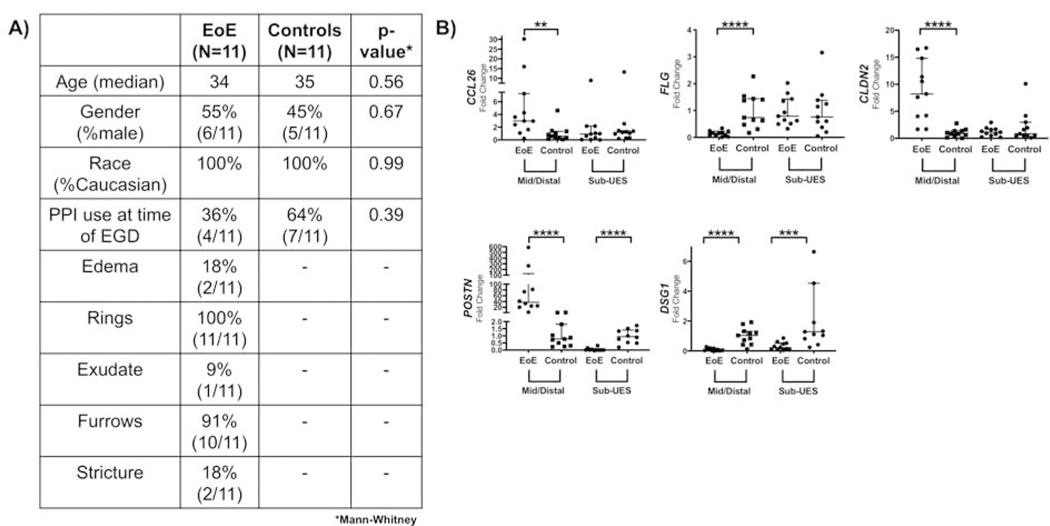
Figure 4: EoE candidate genes do not follow the same mRNA expression patterns by qPCR in the sub-UES, except DSG1.
(A) Patient Demographics for patients in which high quality tissue was extracted. (B) There is increased CCL26 (**P<0.01, 6.6-fold increase, n=11), CLDN2 (***P<0.001, 8.9-fold increase, n=11), and POSTN (****P<0.0001, 115.7-fold increase, n=10–11, 1 distal EoE excluded by Grubb’s test) mRNA expression in mid/distal biopsies but not in sub-UES biopsies of patients with active EoE. POSTN mRNA expression is significantly decreased (***P<0.001, 95% decrease, n=10–11, 1 sub-UES control excluded because it was an outlier by Grubb’s test) in the sub-UES region of EoE patients with active disease. There is decreased FLG (***P<0.001, 85% decrease, n=11) in mid/distal biopsies but not in sub-UES biopsies of patients with active EoE. Finally, DSG1 mRNA expression is significantly decreased in both mid/distal (****P<0.001, 91% decrease, n=11) and sub-UES regions (***P<0.001, 87% decrease, n=11) of patients with active EoE.
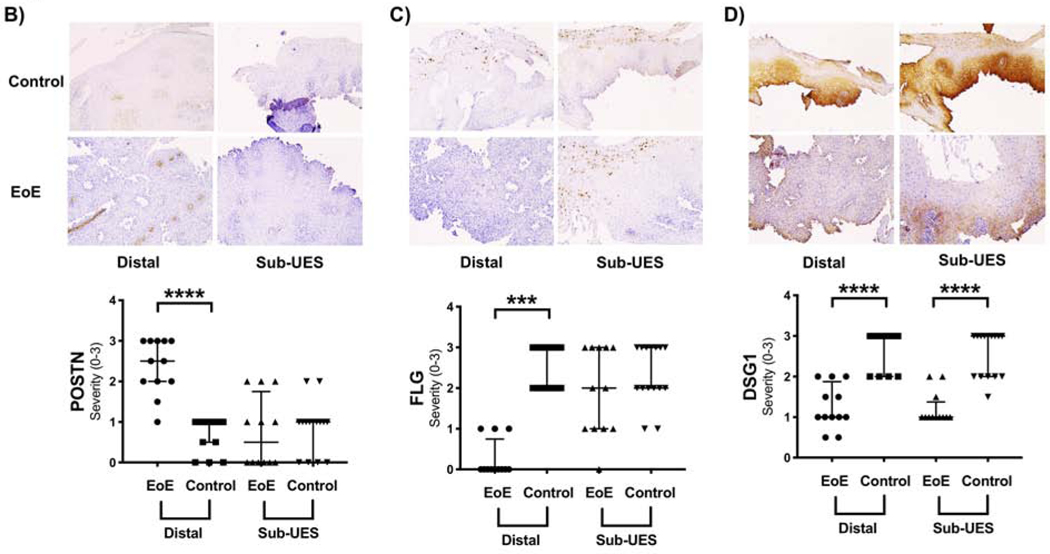
Figure 5: EoE candidate genes do not follow the same protein expression patterns by immunohistochemistry (IHC) in the sub-UES, except DSG1.
(A) Patient Demographics for patients in which IHC was performed. (B) POSTN staining is increased in distal EoE (****P<0.0001, 2.5, 2–3 vs. 1, 0.5–1, n=12–15) but not in the sub-UES region (P=0.62) of EoE patients with active disease. (C) FLG staining is decreased in distal EoE (****P<0.0001, 0, 0–0.75 vs. 3, 2–3, n=12–15) but not in the sub-UES region (P=0.35) of active EoE patients. (D) DSG1 staining is decreased in patients with active EoE in both the distal region (****P<0.001, 1, 1–1.8 vs. 3, 2–3, n=12–15) and the sub-UES region (***P<0.001, 1, 1–1.38 vs. 3, 2–3, n=12–15).
Sub-UES Region Differs from Mid/Distal Esophagus in Patients with Active EoE:
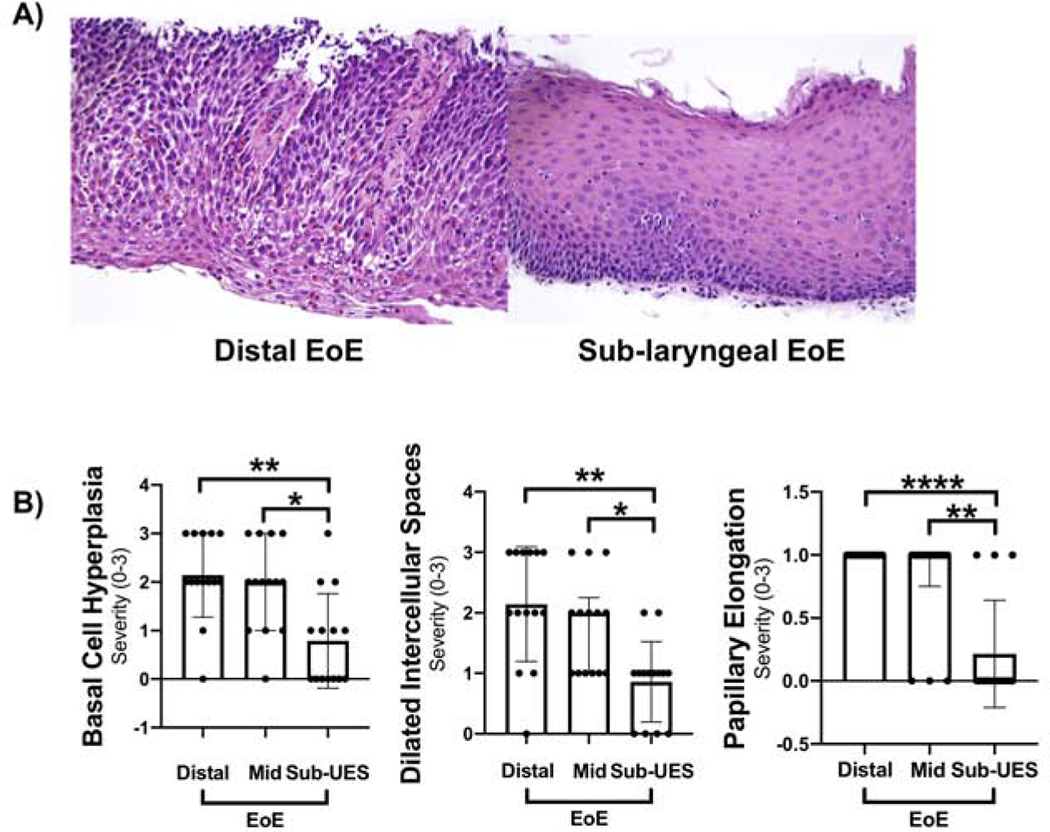
The eosinophil number was significantly lower in the sub-UES region (Figure 2B) as compared with both the mid and distal regions of the esophagus. MI values were lower at 2, 5, and 10 cm from the GE junction in active EoE patients as compared with controls as we have previously published,14,16 but MI values were not significantly different from controls in the sub-UES region of patients with active EoE (Figure 2C). In the 14 EoE patients (Figure 3A), basal cell hyperplasia, dilated intercellular spaces, and papillary elongation were significantly increased in distal and mid biopsies as compared with sub-UES biopsies (Figure 3C). Other histologic features were not different amongst the groups. Not enough biopsies were sufficiently deep to assess for the presence of fibrosis.
Figure 3: Other histologic features of EoE are not present in the sub-UES.
(A) Representative image of distal active EoE (left) and sub-UES (right) in the same patient with active EoE. (B) There was a significant decrease in basal cell hyperplasia in sub-UES as compared with distal (**P<0.01, 0.5, 0–1.3 vs. 2, 2–3, n=14) and mid biopsies (**P<0.01, 0.5, 0–1.3 vs. 2, 1–3, n=14). There was also a significant decrease in papillary elongation in sub-UES as compared with distal (****P<0.0001, 0, 0–0.25 vs. 1, 1–1, n=14) and mid biopsies (**P<0.01, 0, 0–0.25 vs. 1, 0.75–1). This same pattern occurred with dilated intercellular spaces compared with distal (**P<0.01, 1, 0–1 vs. 2, 1.8–3.0, n=14) and mid EoE biopsies (**P<0.01, 1, 0–1 vs. 2, 1–2.3, n=14). There was no significant difference between severity of these histologic features in mid vs. distal EoE biopsies.
Figure 4B outlines the qPCR for EoE candidate genes CCL26 (eotaxin-3), POSTN (periostin), FLG (filaggrin), and DSG1 (desmoglein-1). CCL26, a potent chemoattractant for eosinophils,6 was significantly upregulated in the distal esophagus of active EoE but not in the sub-UES region. The same was true for POSTN, which is important in esophageal remodeling and facilitates eosinophilic infiltration.4 Interestingly, there was significantly decreased expression of POSTN in the sub-UES region of active EoE patients as compared with controls. FLG, a cutaneous structural protein that is downregulated in active EoE and leads to barrier dysfunction,12 was significantly decreased in mid/distal tissue but not in the sub-UES. However, DSG-1, which is downregulated in EoE,8 has decreased mRNA expression in both the mid/distal tissue and sub-UES tissue from patients with active EoE. CLDN2, resulting in increased permeability in intestinal cell lines and tissue,22,23 was significantly upregulated in mid/distal tissues but not in the sub-UES of patients with active EoE.
To determine if differences in mRNA transcripts translated to the protein level, we performed IHC for POSTN, FLG, and DSG1 on a subset of patients with available paraffin embedded sections (Figure 5A). Similar to our results qPCR results, there was relatively increased protein expression of POSTN (Figure 5B) in the mid/distal region of EoE patients as compared with controls but no difference in the sub-UES region. There was significantly decreased FLG (Figure 5C) protein expression in mid/distal active EoE but not in the sub-UES. Finally, there was decreased DSG1 (Figure 5D) protein expression in both the mid/distal and sub-UES of patients with active EoE.
Sub-UES region may help differentiate EoE from lichen planus:
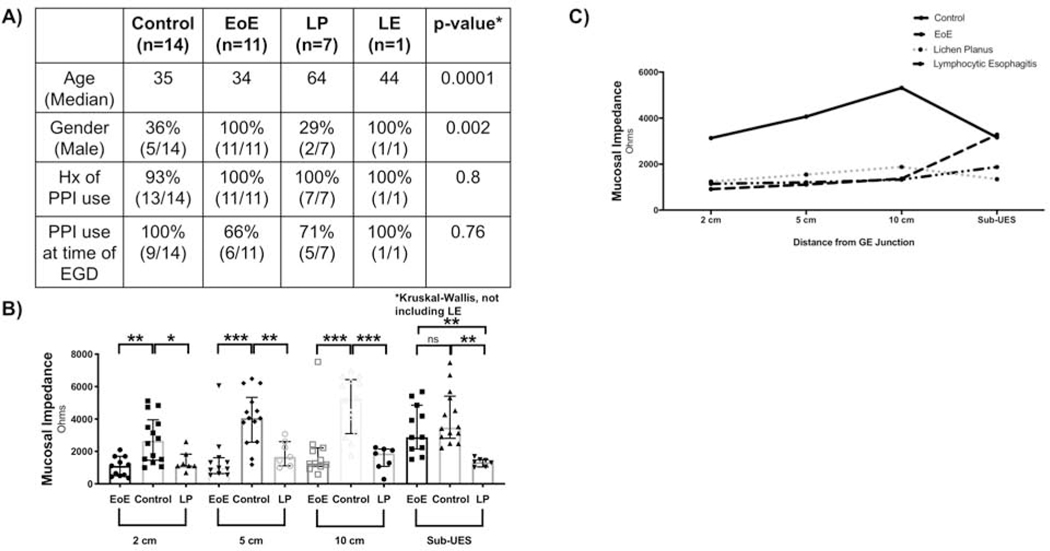
We next compared MI at 2, 5, and 10 cm from the GE junction and sub-UES region of control, active EoE, and lichen planus patients. The demographics of these patients are shown in Figure 6A. Just as in EoE, lichen planus patients showed decreased MI at 2, 5, and 10 cm from the GE junction. However, in the sub-UES region, MI remained significantly lower in the sub-UES region of lichen planus patients as compared to those with EoE (Figure 6B and 6C).
Figure 6: Sub-UES mucosal impedance may differentiate EoE from lichen planus.
(A) Patient Demographics for patients with sub-laryngeal MI measured. (B) Patients with Lichen Planus have significantly lower MI than control patients at 2 cm (*P<0.05, 1113, 1107–1833 vs. 2647, 1457–3959, n=7–14), 5 cm (**P<0.01, 1660, 1111–2602 vs. 4059, 2570–5337, n=7–14), and 10 cm (***P<0.001, 1876, 1074–2145 vs. 5240, 3099–6429, n=7–14) from the GE junction but have similar MI to patients with active EoE. At the sub-UES, lichen planus patients have significantly lower MI than controls (****P<0.0001, 1344, 1046–1488 vs. 3471, 2803–5407, n=7–14) and active EoE patients (***P<0.001, 1344, 1046–1488 vs. 2880, 2149–4858, n=7–11). (C) Schematic showing MI values 2 cm, 5 cm, 10 cm, and sub-UES for controls, active EoE, and lichen planus.
Sub-UES eosinophils may predict a poorer prognosis:
At the end of the study, we retrospectively compared patients with sub-UES eosinophils versus those without them (Supplemental Table 1). Patients with sub-UES eosinophils were significantly younger than those without eosinophils. There was no difference in the number of years patients were followed after index endoscopy, as each group was followed for an average of 1 year. Following index endoscopy, there was a significantly greater number of endoscopies required in patients with sub-UES eosinophils. 3/8 patients with sub-UES eosinophils had food impaction while 0/6 patients without sub-UES eosinophils did. Finally, patients with sub-UES eosinophils had a greater number of therapy escalations.
DISCUSSION
In this report, we demonstrate that the sub-UES epithelium is different than the mid/distal epithelium in patients with active EoE by eosinophil number, mucosal impedance, histologic analysis for several EoE features, and mRNA/protein expression of EoE candidate genes. To the best of our knowledge, this is the first study of its kind. The potential clinical implications of our study are (1) that the MI in the sub-UES region may be used to differentiate EoE from lichen planus and (2) that the presence of any sub-UES eosinophils may portend a more aggressive disease course, as these patients required more therapy escalations, including endoscopic interventions and changes to medication adjustments.
While the epithelium of the sub-UES is normal in active EoE, it is abnormal in all of our lichen planus cases. These findings raise several questions about the pathophysiology of EoE. EoE is an allergy-mediated disease, and as such it is unclear why the sub-UES would be relatively protected as compared to the rest of the esophagus. Since symptom response to PPI therapy in adults ranges from 25–80% and histologic remission after PPI therapy from 33–61%,24 one explanation is that reflux (acid or non-acid) is required, in some subtypes of EoE, for allergens to penetrate the mucosal barrier. In our EoE patients, the expression of DSG-1 remains decreased in the sub-UES region both by qPCR and IHC. If the sub-UES is protected from reflux, this would be consistent with our hypothesis. Our data showed that 4/8 patients with sub-UES eosinophils were on PPI at the time of endoscopy, while only 1/6 patients without sub-UES eosinophils were. Though 12/14 EoE patients had failed PPI therapy in the past, we do not know how long the patients who were not on PPI at the time of endoscopy were off the medication. Thus, future studies should determine the role of acid and non-acid reflux in eosinophil recruitment to the sub-UES.
Another explanation for why the sub-UES is spared may be related to a differing innervation pattern of skeletal muscle in the upper third of the esophagus rather than smooth muscle. A recent report suggests that nerves in the muscularis mucosa can release eosinophil chemoattractants,25 and if these nerve fibers are less abundant near the sub-UES (due to distinct skeletal muscle innervation), or don’t innervate the sub-UES itself, that could explain decreased eosinophilic infiltration. The presence of saliva should also be considered. A recent report26 demonstrates that the salivary microbiome is altered in EoE, and perhaps the salivary microbial population is producing substances that either neutralize or decrease production of eotaxin in the sub-UES epithelium.
On the other hand, lichen planus patients exhibited low MI in the sub-UES, suggesting that it is pan-esophageal and not unmasked by reflux. Lichen planus is a subacute to chronic inflammatory disease affecting the skin, mucous membranes, nails and at times the esophagus. Oral lichen planus is thought to be a T-cell mediated autoimmune disease,27 and though little is known about esophageal lichen planus, it is likely related to same pathophysiology. Lichen planus presents in older females while EoE is a disease of younger males, but these demographics do not apply to all patients. Given that there can be difficulty in distinguishing these clinical conditions, much more work needs to be done to investigate the pathogenesis of both these disorders.
Some limitations of our study should be highlighted. First, our study included small sample sizes, and we did not have complete data (i.e. MI, qPCR, and IHC) on all of the patients. Second, the majority of our EoE patients (12/14) had previously failed PPI therapy, and only 5/14 were on PPI at the time of endoscopy. Thus, we cannot comment on eosinophilic infiltration of the sub-UES prior to PPI therapy, whether or not eosinophils in the sub-UES can predict PPI response, or whether acid or non-acid reflux contributes to eosinophilic infiltration of the sub-UES. Third, the data suggesting a correlation between sub-UES eosinophils and an aggressive disease course was collected retrospectively by chart review, leaving open the possibility that some relevant information is missing, as these patients could have gotten care at other institutions. Thus, further prospective investigation is needed to determine whether these findings are true. Fourth, there are limitations concerning the MI catheter. As previously noted,14 our catheter contains only 2 impedance rings, forming a single MI sensing channel. Since the catheter was manually repositioned from one site to the next along the esophagus, there could be variability related to this. The 360-degree circumferential ring design may not be better than 180 degrees, as only 180 degrees are needed to oppose the mucosa. This design could potentially lead to interference from intraluminal contents such as air and liquid. In order to combat this, we have recently developed a next-generation catheter28 to help reduce variability in MI measurement.
There are several future directions for this project. We plan to characterize the sub-UES in lymphocytic esophagitis (LE), another esophageal inflammatory disorder, using MI. Thus far, we have measured MI in one patient with LE, and the findings are similar to the lichen planus patients, with low MI at 2, 5, and 10 cm from the GE junction in addition to low MI in the sub-UES (data not shown). Moreover, in addition to characterizing the differences in the epithelium, we plan to determine if immune cell populations besides eosinophils are different (e.g. mast cells, natural killer cells, dendritic cells) – not only in EoE but also in lichen planus and LE. Furthermore, the susceptibility of the sub-UES epithelium to the EoE cytokine signature should be interrogated. Since IL-13 is known to induce epithelial barrier dysfunction,8,11 it is possible that the sub-UES epithelium may reveal a protective mechanism preventing or decreasing eosinophilic infiltration. The same could be true of other Th2 cytokines, including IL-4 and IL-5.
Our observations about the sub-UES region of the esophagus raise several questions about the pathophysiology of EoE and other esophageal inflammatory disorders. As such, they have the potential to increase our understanding of the esophageal epithelium while also changing clinical practice.
Supplementary Material
Supplemental Table 1: Comparison of EoE patients with sub-UES eosinophils versus those without sub-UES eosinophils.
WHAT YOU NEED TO KNOW.
Background:
We investigated how the sub- upper esophageal sphincter (UES) region differs from the remaining esophagus in patients with EoE and aimed to determine whether it can be used to distinguish patients with EoE from those with lichen planus.
Findings:
Sub-UES tissues from patients with EoE differ in numbers of eosinophils, histologic features, and MI compared to controls or patients with lichen planus.
Implications for patient care:
We identified factors that might be used to differentiate EoE from lichen planus.
ACKNOWLEDGEMENTS
The authors thank members of the Williams laboratory and Vaezi Research Group for thoughtful discussions about this research project. This work was supported by National Institutes of Health grants R01DK099204 to CSW, 5T32DK00767322 to YAC, 5P30DK058404–17 (Vanderbilt Digestive Disease Research Center) to MKW; and Office of Medical Research, Department of Veterans Affairs (Merit Review Grants 1I01 BX001426 to CSW). This publication was also supported by CTSA award UL1TR000445 from the National Center for Advancing Translational Sciences. The content is solely the responsibility of the authors and does not necessarily represent the official views of the NIH.
Footnotes
Conflict of interest: Vanderbilt University and Diversatek Healthcare Inc. (Denver, CO, USA) jointly hold a patent on the mucosal impedance (MI) concept and device. This was disclosed to patients. Dr. Vaezi (MV) has had research funding from Diversatek Healthcare in the conduct of studies with mucosal impedance. Diversatek Healthcare had no influence on the study design, conduct, analysis or the final manuscript. There are no financial relationships between any of the other authors and Diversatek Healthcare Inc. All other authors (YC, JC, MB, RS, SS, SF, TH, GH, FR, MKW, CSW) have no conflicts of interest.
Publisher's Disclaimer: This is a PDF file of an unedited manuscript that has been accepted for publication. As a service to our customers we are providing this early version of the manuscript. The manuscript will undergo copyediting, typesetting, and review of the resulting proof before it is published in its final form. Please note that during the production process errors may be discovered which could affect the content, and all legal disclaimers that apply to the journal pertain.
REFERENCES
- 1.Dellon ES, Jensen ET, Martin CF, et al. Prevalence of Eosinophilic Esophagitis in the United States. Clin Gastroenterol Hepatol. 2014. April;12(4):589–96. [DOI] [PMC free article] [PubMed] [Google Scholar]
- 2.Dellon ES, Erichsen R, Baron JA, et al. The increasing incidence and prevalence of eosinophilic oesophagitis outpaces changes in endoscopic and biopsy practice: national population-based estimates from Denmark. Aliment Pharmacol Ther. 2015. April;41(7): 662–70. [DOI] [PMC free article] [PubMed] [Google Scholar]
- 3.Giriens B, Yan P, Safroneeva E, et al. Escalating incidence of eosinophilic esophagitis in Canton of Vaud, Switzerland, 1993–2013: a population-based study. Allergy 2015. December;70(12):1633–1639. [DOI] [PubMed] [Google Scholar]
- 4.Sleiman PM, Wang ML, Cianferoni A, et al. GWAS identifies four novel eosinophilic esophagitis loci. Nat Commun. 2014. November;19(5): 5593. [DOI] [PMC free article] [PubMed] [Google Scholar]
- 5.Kottyan LC, Davis BP, Sherrill JD, et al. Genome-wide association analysis of eosinophilic esophagitis provides insight into the tissue specificity of this allergic disease. Nat Genet. 2014. August; 46(8): 895–900. [DOI] [PMC free article] [PubMed] [Google Scholar]
- 6.Blanchard C, Wang N, Stringer KF, et al. Eotaxin-3 and a uniquely conserved gene-expression profile in eosinophilic esophagitis. J Clin Invest. 2006. February; 116(2): 536–547. [DOI] [PMC free article] [PubMed] [Google Scholar]
- 7.Blanchard C, Mingler MK, McBride M, et al. Periostin facilitates eosinophil tissue infiltration in allergic lung and esophageal responses. Mucosal Immunol. 2008. July; 1(4): 289–296. [DOI] [PMC free article] [PubMed] [Google Scholar]
- 8.Sherrill JD, Kc K, Wu D, et al. Desmoglein-1 regulates esophageal epithelial barrier function and immune responses in eosinophilic esophagitis. Mucosal Immunol. 2014. May; 7(3): 718–729. [DOI] [PMC free article] [PubMed] [Google Scholar]
- 9.Nguyen N, Fernando SD, Biette KA, et al. TGF-β1 alters esophageal epithelial barrier function by attenuation of claudin-7 in eosinophilic esophagitis. Mucosal Immunol. 2018. March; 11(2):415–426. [DOI] [PMC free article] [PubMed] [Google Scholar]
- 10.Jiang M, Ku WY, Zhou Z, et al. BMP-driven NRF2 activation in esophageal basal cell differentiation and eosinophilic esophagitis. J Clin Invest. 2015. April; 125(4): 1557–1568. [DOI] [PMC free article] [PubMed] [Google Scholar]
- 11.Davis BP, Stucke EM, Khorki ME, et al. Eosinophilic esophagitis-linked calpain 14 is an IL-13-induced protease that mediates esophageal epithelial barrier impairment. JCI Insight. 2016. April;1(4): e86355. [DOI] [PMC free article] [PubMed] [Google Scholar]
- 12.Katzka DA, Tadi R, Smyrk TC, et al. Effects of topical steroids on tight junction proteins and spongiosis in esophageal epithelia of patients with eosinophilic esophagitis. Clin Gastroenterol Hepatol 2014;12:1824–1829. [DOI] [PubMed] [Google Scholar]
- 13.Saritas Yuksel E, Higginbotham T, Slaughter JC, et al. Use of direct, endoscopic-guided measurements of mucosal impedance in diagnosis of gastroesophageal reflux disease. Clin Gastroenterol Hepatol. 2012. October;10(10):1110–6. [DOI] [PubMed] [Google Scholar]
- 14.Ates F, Yuksel ES, Higginbotham T, et al. Mucosal Impedance discriminates GERD from non-GERD conditions. Gastroenterology. 2015. February;148(2):334–43. [DOI] [PubMed] [Google Scholar]
- 15.Katzka DA, Ravi K, Geno DM, et al. Endoscopic Mucosal Impedance Measurements Correlate with Eosinophilia and Dilation of Intercellular Spaces in Patients with Eosinophilic Esophagitis. Clin Gastroenterol Hepatol. 2015. July;13(7):1242–1248. [DOI] [PubMed] [Google Scholar]
- 16.Choksi Y, Lal P, Slaughter JC, et al. Esophageal Mucosal Impedance Patterns Discriminate Patients with Eosinophilic Esophagitis From Patients With GERD. Clin Gastroenterol Hepatol. 2018. May;16(5): 664–671. [DOI] [PubMed] [Google Scholar]
- 17.Collins MH, Martin LJ, Alexander ES, et al. Newly developed and validated eosinophilic esophagitis histology scoring system and evidence that it outperforms peak eosinophil count for disease diagnosis and monitoring. Dis. Esophagus. 2017. February;30(3):1–8. [DOI] [PMC free article] [PubMed] [Google Scholar]
- 18.Dellon ES. Epidemiology of eosinophilic esophagitis. Gastroenterol. Clin. North Am. 2014. June;43(2): 201–218. [DOI] [PMC free article] [PubMed] [Google Scholar]
- 19.Dellon ES, Gibbs WB, Fritchie KJ, et al. Clinical, endoscopic, and histologic findings distinguish eosinophilic esophagitis from gastroesophageal reflux disease. Clin. Gastroenterol. Hepatol. 2009. December;7(12):1305–1313. [DOI] [PMC free article] [PubMed] [Google Scholar]
- 20.Franciosi JP, Tam V, Liacouras CA, et al. A case-control study of sociodemographic and geographic characteristics of 335 children with eosinophilic esophagitis. Clin. Gastroenterol. Hepatol. 2009. April;7(4):415–419. [DOI] [PubMed] [Google Scholar]
- 21.Blanchard C, Stucke EM, Burwinkel K, et al. Coordinate interaction between IL-13 and epithelial differentiation cluster genes in eosinophilic esophagitis. J Immunol 2010. April; 184(7): 4033–4041. [DOI] [PMC free article] [PubMed] [Google Scholar]
- 22.Suzuki T, Yoshinaga N, Tanabe S. Interleukin-6 (IL-6) Regulates Claudin-2 Expression and Tight Junction Permeability in Intestinal Epithelium. J Biol Chem. 2011. September;286(36): 31263–31271. [DOI] [PMC free article] [PubMed] [Google Scholar]
- 23.Zeissig S, Bürgel N, Günzel D, et al. Changes in expression and distribution of claudin 2, 5, and 8 lead to discontinuous tight junctions and barrier dysfunction in active Crohn’s disease. Gut 2007. January; 56(1): 61–72. [DOI] [PMC free article] [PubMed] [Google Scholar]
- 24.Molina-Infante J, Katzka D, Gisbert J. Review article: proton pump inhibitor therapy for suspected eosinophilic oesophagitis. Aliment Pharmacol Ther 2013. June; 37(12): 1157–64. [DOI] [PubMed] [Google Scholar]
- 25.Verma A, Manohar M, Venkateshaiah S, et al. Role of Vasoactive Intestinal Peptide in Promoting the Pathogenesis of Eosinophilic Esophagitis (EoE). CMGH 2018. September; 5(1): 99–100.e7. [DOI] [PMC free article] [PubMed] [Google Scholar]
- 26.Hiremath G, Shilts M, Boone H, et al. The Salivary Microbiome is Altered in Children with Eosinophilic Esophagitis and Correlates With Disease Activity. Clin Transl Gastroenterol 2019. June; 10(6): e00039. [DOI] [PMC free article] [PubMed] [Google Scholar]
- 27.Sugerman P, Satterwhite K, Bigby M. Autocytotoxic T-cell clones in lichen planus. Br J Dermatol 2000. March; 142(3): 449–56. [DOI] [PubMed] [Google Scholar]
- 28.Patel D, Higginbotham T, Slaughter J, et al. Development and Validation of a Mucosal Impedance Contour Analysis System to Distinguish Esophageal Disorders. Gastroenterology 2019. May; 156(6):1617–1626.e1. [DOI] [PMC free article] [PubMed] [Google Scholar]
Associated Data
This section collects any data citations, data availability statements, or supplementary materials included in this article.
Supplementary Materials
Supplemental Table 1: Comparison of EoE patients with sub-UES eosinophils versus those without sub-UES eosinophils.


