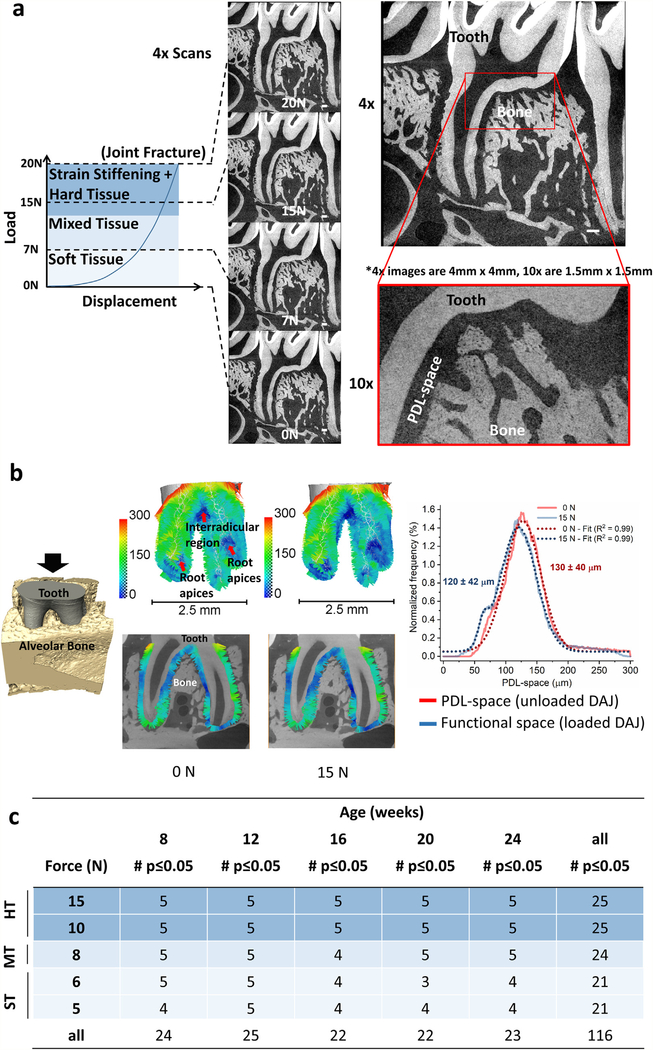
Fig. 1 –
DAJ biomechanics, and PDL-spaces and functional-spaces of respective DAJs. (a) A representative nonlinear load-displacement curve represents plausible biomechanical events as the tooth is compressed into the alveolar socket (refer to Supplemental Figure S1 for gif animation). Identical virtual sections taken at 0 N, 7 N, 15 N and 20 N load increments illustrate tooth position relative to the alveolar socket with increasing load. White bars = 200 μm. (b) (left) The configuration of the tooth and bony socket showed the relative position of the tooth at 0 N and 15 N. (center) Tethered vectors highlight PDL-space (DAJ at no load) and functional-space (DAJ under load) with narrowed and widened spaces within the interradicular and apical regions under simulated loading conditions. (right) Histograms illustrated PDL-space at 0 N (red) and functional-space at 15 N (blue) along with Gaussian fits (dashed red and blue lines). (c) Analyses of load-displacement curves illustrated the number (out of 5) of DAJs from soft and hard food groups that expressed stiffness values which are statistically different at 7, 15, and 20 N. HT - hard tissue; MT - mixed tissue; ST- soft tissue.

